
System and method for energy infrastructure and geospatial data visualization, management, and analysis using environment simulation and virtual realization

a geospatial data visualization and environment simulation technology, applied in the field of systems, apparatus and methods for optimizing inspection of electrical power grid infrastructure, can solve the problems of inability to manage the volume of lidar data collected from flight vehicles flying along known power line routes, requiring skilled, trained personnel to perform vast amounts of review efforts, and requiring many hours

Pending Publication Date: 2022-04-28
DAVIS II MICHAEL ANDREW
View PDF0 Cites 0 Cited by
  • Summary
  • Abstract
  • Description
  • Claims
  • Application Information

AI Technical Summary

Benefits of technology

LIDAR systems are used for geospatial three-dimensional scanning by using light pulses to measure distances. LIDAR technology is a combination of light and radar, and is commonly used in meteorology to measure clouds and pollution. It provides high-resolution distance data with relatively short wavelength. Overall, LIDAR technology offers precise and efficient means for gathering three-dimensional information.

Problems solved by technology

Current technology is, however, incapable of managing the volume of lidar data collected from flight vehicles flying along known power line routes, such as power line routes extending many miles.
Reviewing post-processed lidar data is a further unduly tedious, manual process that requires skilled, trained personnel to perform vast amounts of review efforts requiring many hours.
Existing visualization software is limited and can only process small portions of the lidar data at any time.

Method used


Image

  • System and method for energy infrastructure and geospatial data visualization, management, and analysis using environment simulation and virtual realization
  • System and method for energy infrastructure and geospatial data visualization, management, and analysis using environment simulation and virtual realization
  • System and method for energy infrastructure and geospatial data visualization, management, and analysis using environment simulation and virtual realization

Examples


Embodiment Construction

[0165]In this detailed description, reference is made to the accompanying drawings which form a part hereof, and in which is shown by way of illustration specific embodiments which may be practiced. Reference now should be made to the drawings, in which the same reference numbers are used throughout the different figures to designate the same components. These embodiments are described in sufficient detail to enable those skilled in the art to practice the embodiments and disclosure. It is to be understood that other embodiments may be utilized, and that logical, mechanical, electrical, and other changes may be made without departing from the scope of the embodiments and disclosure. In view of the foregoing, the following detailed description is not to be taken as limiting the scope of the embodiments or disclosure.

[0166]The terminology used herein is for the purpose of describing particular embodiments only and is not intended to be limiting. As used herein, the singular forms “a”,...


PUM


Abstract

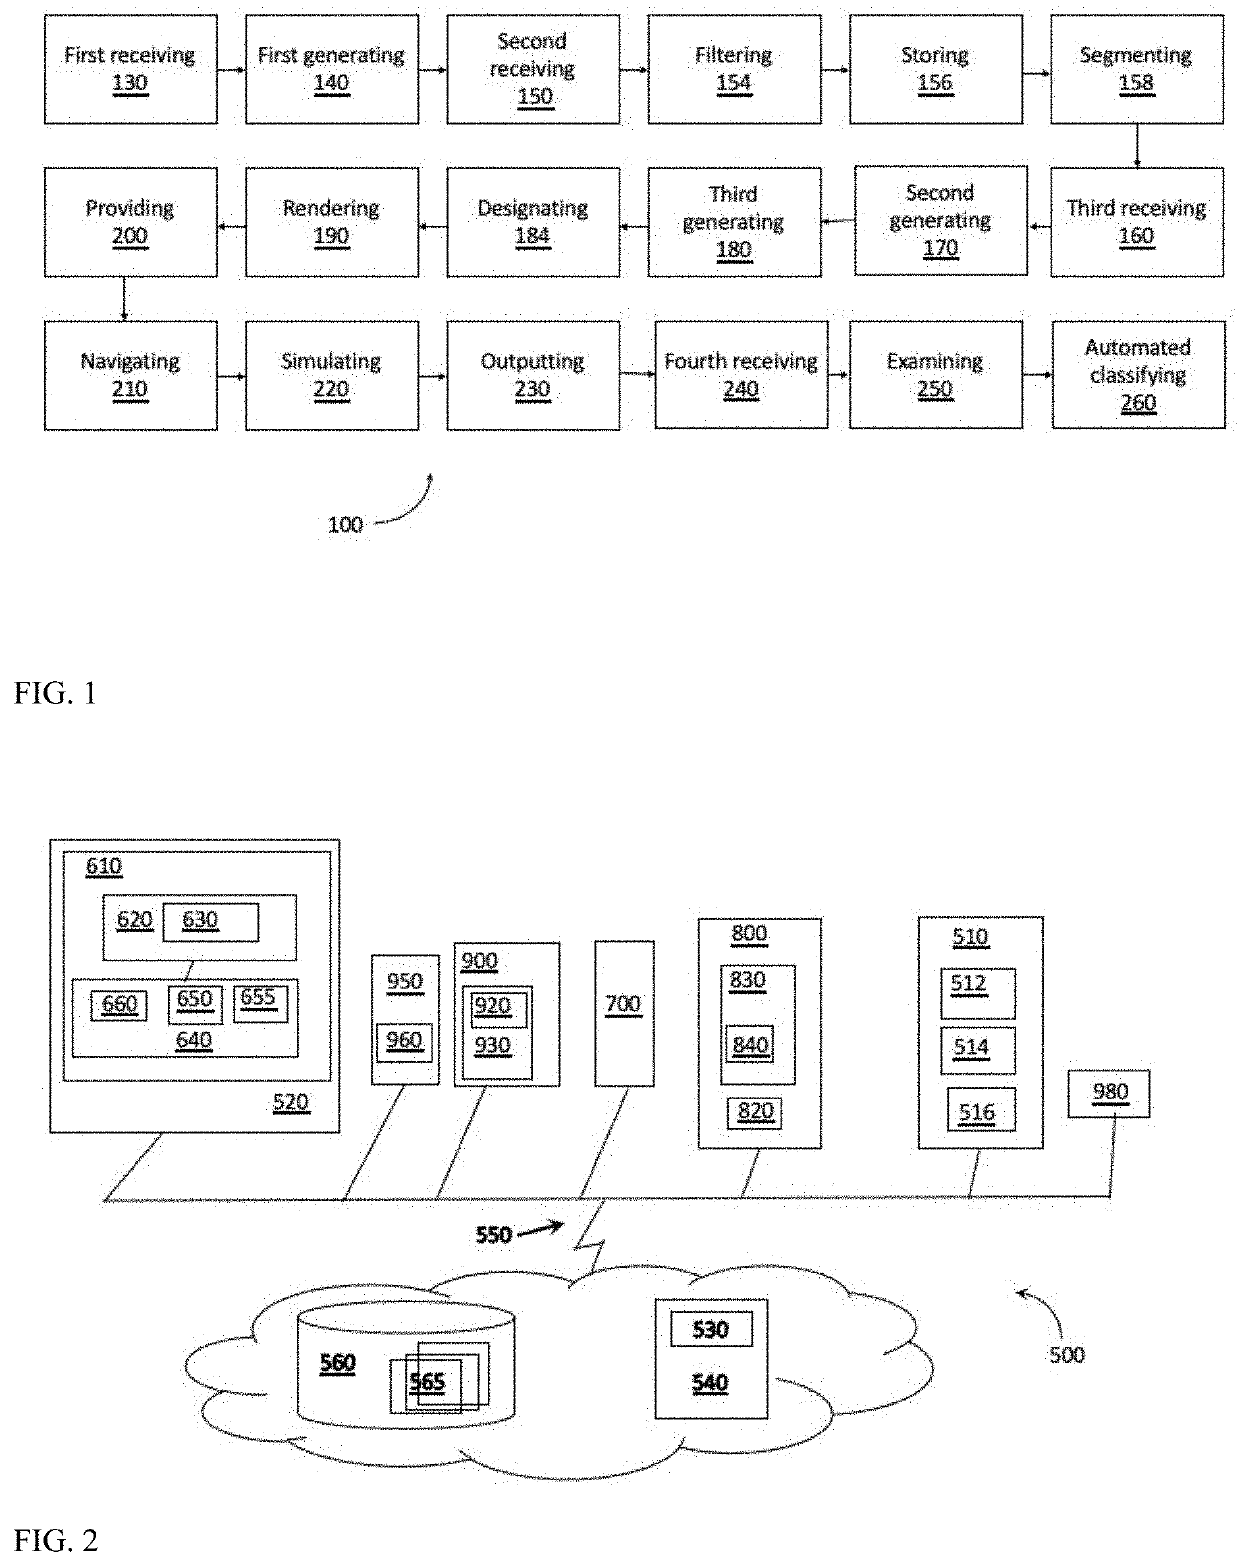
A method for managing an electric utility power grid including a utility power line route may include generating an infrastructure model including utility assets and image information; receiving power line imaging data collected on the route and including utility asset imaging data; receiving geospatial topological model information; and generating a navigable simulated virtual environment model including an integrated visualization of infrastructure model image information with geospatial topological model image information and power line imaging data. A trained classification algorithm categorizes the condition of utility assets on the route from virtual views.

Description

CROSS-REFERENCE TO RELATED APPLICATIONS[0001]This application is related and claims priority to U.S. Provisional Application 63 / 106,119 filed Oct. 27, 2020 and titled “System and Method for Energy Infrastructure and Geospatial Data Visualization, Management, and Analysis Using Environment Simulation and Virtual Realization,” which is hereby incorporated by reference in entirety.FIELD OF THE INVENTION[0002]The disclosure generally relates to systems, apparatus and methods for electrical power grid operation, maintenance, repair, resiliency, and post-storm recovery. More particularly, the disclosure relates to systems, apparatus, and methods for optimizing inspection of electrical power grid infrastructure.BACKGROUND OF THE INVENTION[0003]In the context of electric utility power grid (“grid”) infrastructure for distribution of electricity, resiliency is the capability to maintain optimal grid performance during system disruptions and recover quickly from such system disruptions. Many ...

Claims


Application Information

Patent Timeline
IPC IPC(8): H02J3/00H02J3/34
CPCH02J3/003H02J3/34H02J3/004H02J13/00001H02J2310/10G06F30/13
Inventor DAVIS, II, MICHAEL ANDREW
Owner DAVIS II MICHAEL ANDREW
Learn More