
Pre-emptive asthma risk notifications based on medicament device monitoring

a technology of asthma risk and medication device, applied in the field of asthma risk notification based on medicament device monitoring, can solve the problems of less available tools to assess the health of patients day-to-day, more than $82 billion per year in direct and indirect costs, and the risk remains a significant and costly public health problem, so as to facilitate the better management of asthma treatment and improve recognition. , the effect of reducing the risk

Active Publication Date: 2021-03-18
RECIPROCAL LABS CORP D B A PROPELLER HEALTH
View PDF1 Cites 3 Cited by
  • Summary
  • Abstract
  • Description
  • Claims
  • Application Information

AI Technical Summary

Benefits of technology

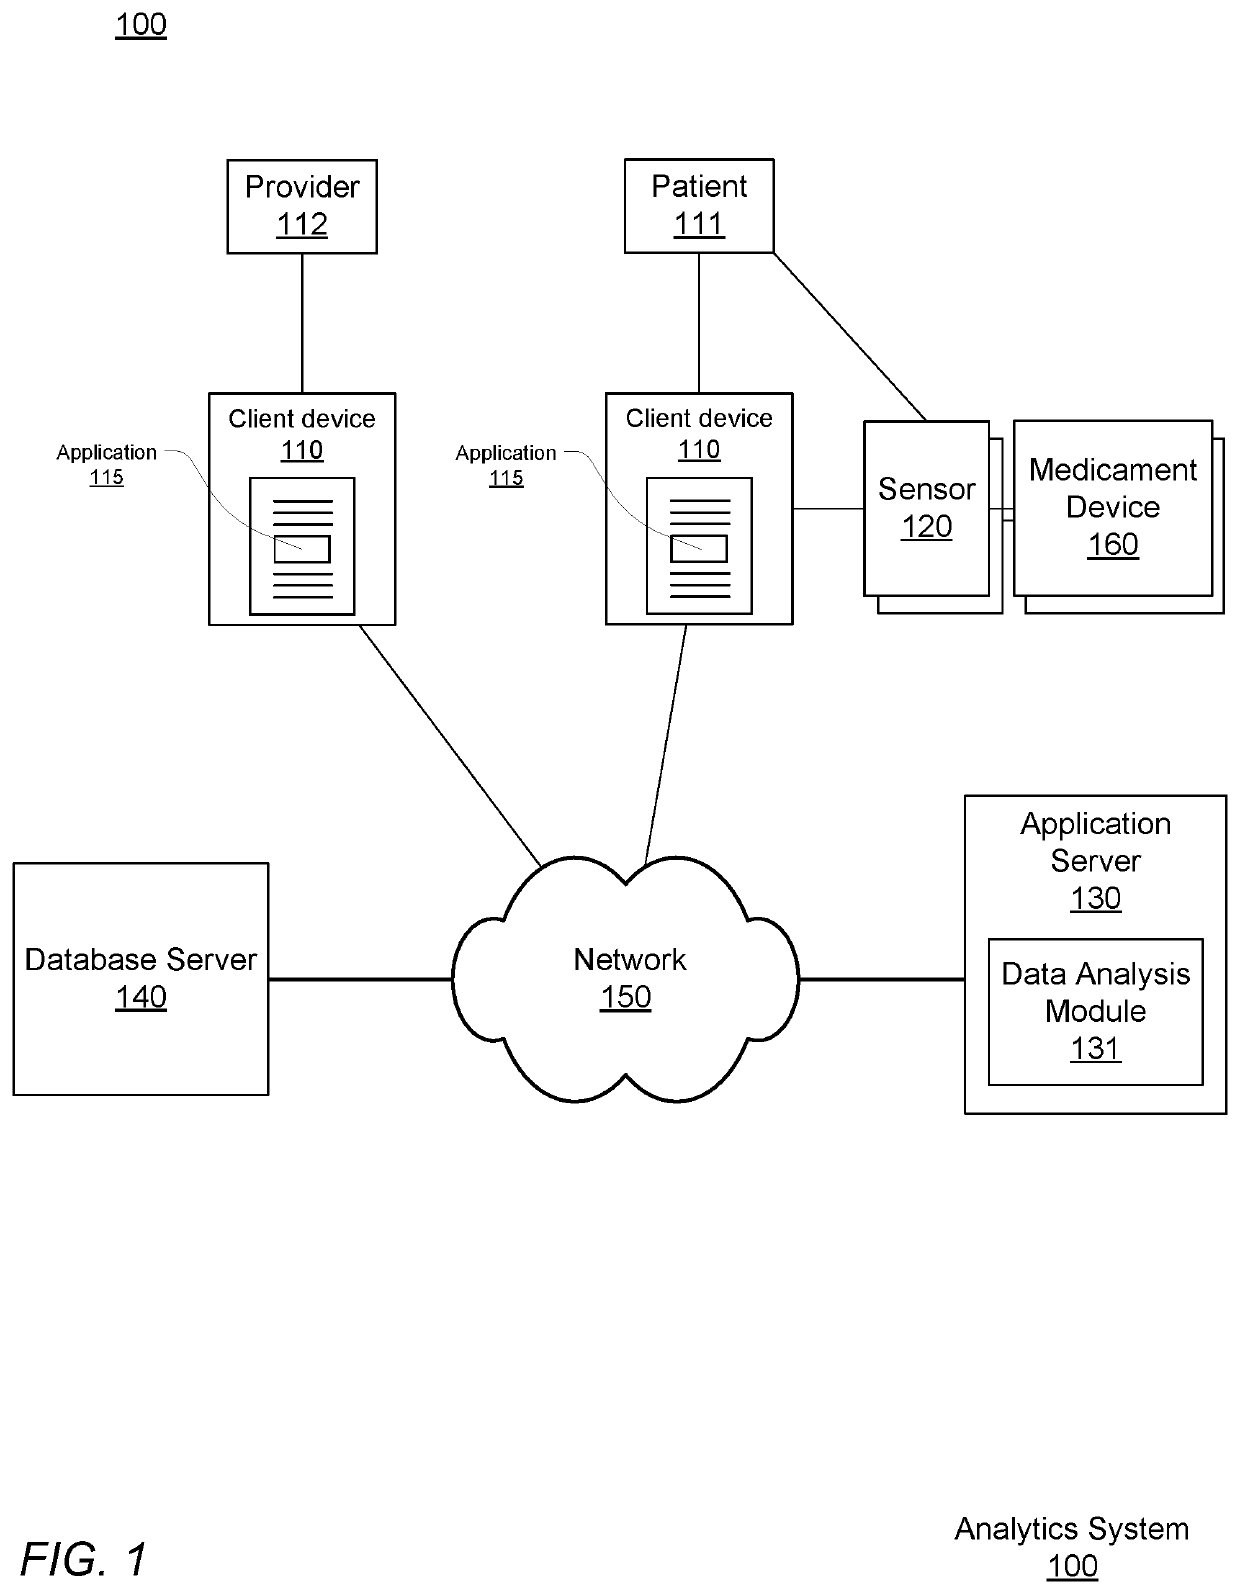
The patent describes a system that uses data from patients and environmental conditions to determine the risk score of a geographic region. This score is combined with information about the timing and location of medication usage to suggest ways to prevent future asthma rescue events. The system also allows patients to make informed decisions about their lifestyle choices based on the risk analysis, so they can improve their health and prepare for respiratory symptoms in advance. The technical effects of the patent are improved risk assessment and management for patients with respiratory diseases and the public at large.

Problems solved by technology

Asthma remains a significant and costly public health problem.
In the United States, asthma affects 1 in 12 individuals in the U.S. and prevalence is on the rise, leading to more than $82 billion per year in direct and indirect costs.
Physicians, however, have few available tools to assess how well their patients are doing day-to-day.
As a result, these questionnaires are subject to error introduced by biases (recall), different interpretations of symptoms, and behaviors (non-adherence), and only provide information at the time they are used.
Knowing which of dozens, hundreds, or more triggers and factors a patient is sensitive to and monitoring those triggers and factors for use in managing symptoms is a complex task and not currently feasible for many patients and providers.

Method used


Image

  • Pre-emptive asthma risk notifications based on medicament device monitoring
  • Pre-emptive asthma risk notifications based on medicament device monitoring
  • Pre-emptive asthma risk notifications based on medicament device monitoring

Examples


example 1

V.A. Example 1

[0153]FIG. 7A characterizes the training data set, by indicating the percentage of days that were labeled as 1's and the percentage of days that labeled as 0's. Additionally, the graphs demonstrate the increase in the number of days categorized as high risk based on a baseline risk threshold that includes the 5% factor as discussed above versus a baseline risk threshold that does not. The dataset is represented per user (patient) per day, joining Propeller Health's™ patient inhaler data to air quality and weather data from the NOAA and EPA historical data sets ranging from Apr. 30, 2012 to Apr. 30, 2017. For users lacking location information, the discrepancies were filled using the most recently logged location during that 24 hour period. If no location was logged during that 24 hour period, the day's data was removed from the dataset. The total dataset comprised 5,309 users and 720,812 user days, of which 15% were categorized as high risk (or 1's). Low risk days are ...

example 2

V.B. Example 2

[0155]FIG. 7B describes the reasoning behind setting the baseline risk threshold as percentage (e.g., 5%) of the previous time period sum of rescue usage events. A previous model (herein referred to as “V1”) has categorized 26% of events as high risk (i.e., label “1”) provided the most optimal combination of AUC Scores, accuracy measurements, and sensitivity and specificity readings (Sample set was based on earlier data with 30,790 patient days of data). Other similar iterations of similar models also categorized 20% of greater of patient days as high risk. This was unrealistic relative to surveyed and separately identified measurements of what percentage of most patient's days are high risk. When designing the training data set for the XGBoost Example Model, the 5% threshold was found to better represent the conventionally determined rate of high risk days (less than 5%, as indicated by FIG. 7a). To train the XGBoost Example Model, a training data was built comprising...

example 3

V.C. Example 3

[0156]FIG. 7C illustrates the same performance metrics for the XGBoost Example Model.

[0157]The training and test data sets are the same data identified in FIG. 7A. These performance metrics suggest a decline in efficacy from the measurements of the V1 model, however the XGBoost Example Model addresses deficiencies of the V1 model. Part of the decrease in specificity can be attributed to a significantly larger amount of low risk days than high risk days. Only 15% of events of the test set of the XGBoost Example Model were high risk, compared to 85% of low risk events. Comparatively, the V1 test set was only 78% low risk events. Additionally, the XGBoost Example Model considers additional parameters in the performance of its risk analysis and risk categorization relative to the V1 model.

[0158]Additionally, the training data set is organized based on the geographical location of each rescue event included in the training data. Based on the recorded parameters for each res...


PUM


Abstract

This description provides risk notifications for a geographic region to inform patients and effect behavior changes to prevent rescue events and exacerbations from occurring. A risk analysis for a geographic region is based on data gathered from a population of patients who may experience respiratory events within the geographic region. Rescue medication events, environmental conditions relevant to the rescue medication events, and other contextually relevant information are detected by sensors associated with a population of patients' medicament device / s and are collected from other sources, respectively, to provide a basis to determine a risk score. This data is analyzed to determine the severity of the risk of a respiratory event occurring within a geographical region and accordingly sending a notification to patients within that geographical region.

Description

CROSS-REFERENCE TO RELATED APPLICATION[0001]This application is the National Stage of International Application No. PCT / US2019 / 033190, filed May 20, 2019, which claims the benefit of U.S. Provisional Application No. 62 / 674,594, filed on May 21, 2018 which are hereby incorporated by reference in their entirety.BACKGROUNDField of Art[0002]The disclosure relates generally to attachments for inhalers for treating respiratory diseases, and also to geography-based respiratory disease predictive models.Description of the Related Art[0003]Asthma remains a significant and costly public health problem. Worldwide, the World Health Organization estimates the population with asthma may be 300 million, and predicts that it will rise to 400 million by 2025. In the United States, asthma affects 1 in 12 individuals in the U.S. and prevalence is on the rise, leading to more than $82 billion per year in direct and indirect costs.[0004]Despite the development of new medications, rates of hospitalizatio...

Claims


Application Information

Patent Timeline
Patent Type & Authority Applications(United States)
IPC IPC(8): G16H50/80G16H10/60G16H50/70G16H40/67G16H20/17G16H50/30G16H50/20A61B5/00A61B5/11A61M15/00G01W1/00
CPCG16H50/80A61M2016/0015G16H50/70G16H40/67G16H20/17G16H50/30G16H50/20A61B5/7275A61B5/1112A61B5/7282A61M15/00A61B5/74G01W1/00A61B2560/0242A61M15/0051A61M2202/064A61M2205/8206A61M2205/52A61M2205/502G16H10/60G16H20/10A61B5/0803A61B5/4842A61M2209/06A61M15/008A61M15/009A61M2205/3553A61M2205/3592A61M2205/3584A61M2202/0007A61M2205/3306
Inventor BARRETT, MEREDITH A.LOHMEIER, MIKEHAMILTON, SHANNON M.TUFFLI, MICHAEL J.STUPAKOV, DMITRYHOGG, CHRISTOPHERVAN SICKLE, JOHN DAVIDTRACY, GREGORY F.SEHMER, MARK WILLIAMLEE, ROBERT AUSTIN
Owner RECIPROCAL LABS CORP D B A PROPELLER HEALTH
Learn More