Identifying missing nodes within a graphically represented family

a family and node technology, applied in the field of missing nodes within a graphically represented family, can solve the problems of combining them, affecting the design of the tree, and containing irregularities in the tree,

Active Publication Date: 2020-02-06
KILPATRICK TOWNSEND & STOCKTON
View PDF2 Cites 9 Cited by
  • Summary
  • Abstract
  • Description
  • Claims
  • Application Information

AI Technical Summary

Problems solved by technology

Each of these two constraints can be handled straightforwardly by itself, but taking them together poses challenges especially as the number of nodes of the graphical tree increases.
Many conventional computer-generated graphical trees contains irregularities (e.g. failing to correctly position interior nodes).
In addition, conventional tree-generating algorithms fail to address all design requirements of a graphical tree (e.g. a child node having multiple parent nodes, relative rendering of two hierarchical families that are affiliated with each other).

Method used


Image

  • Identifying missing nodes within a graphically represented family
  • Identifying missing nodes within a graphically represented family
  • Identifying missing nodes within a graphically represented family

Examples


Embodiment Construction

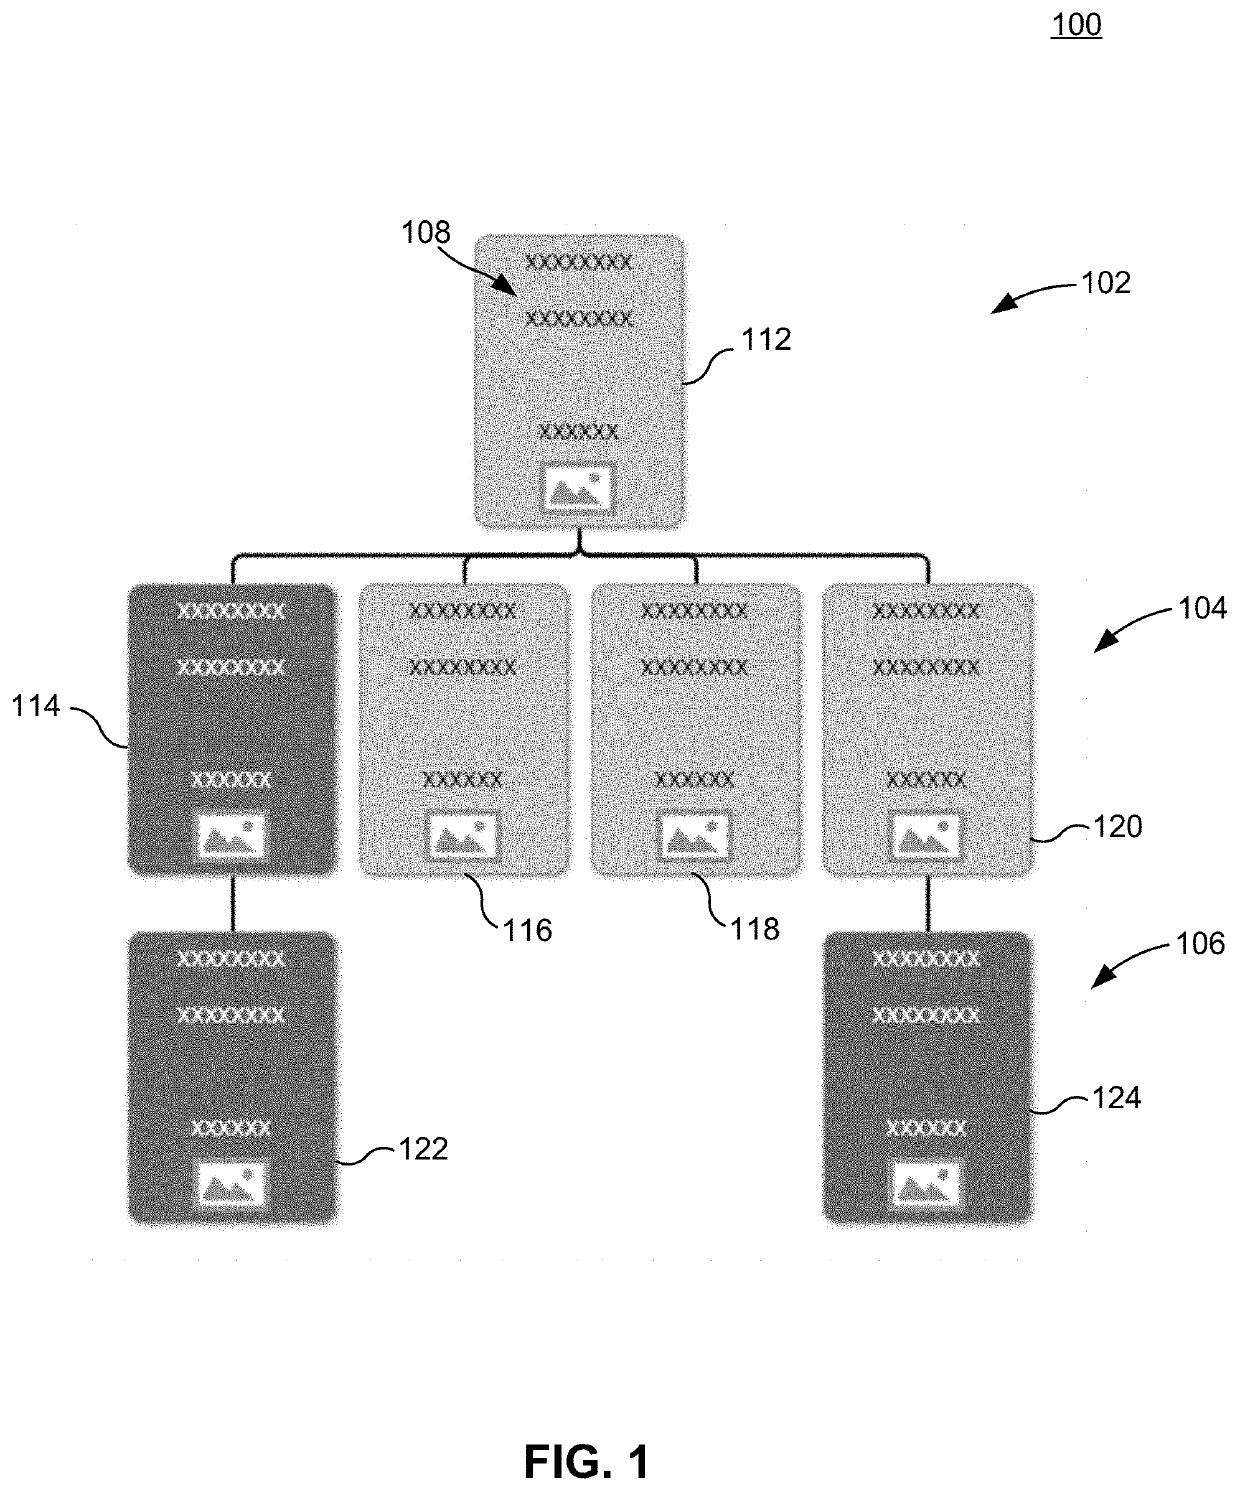
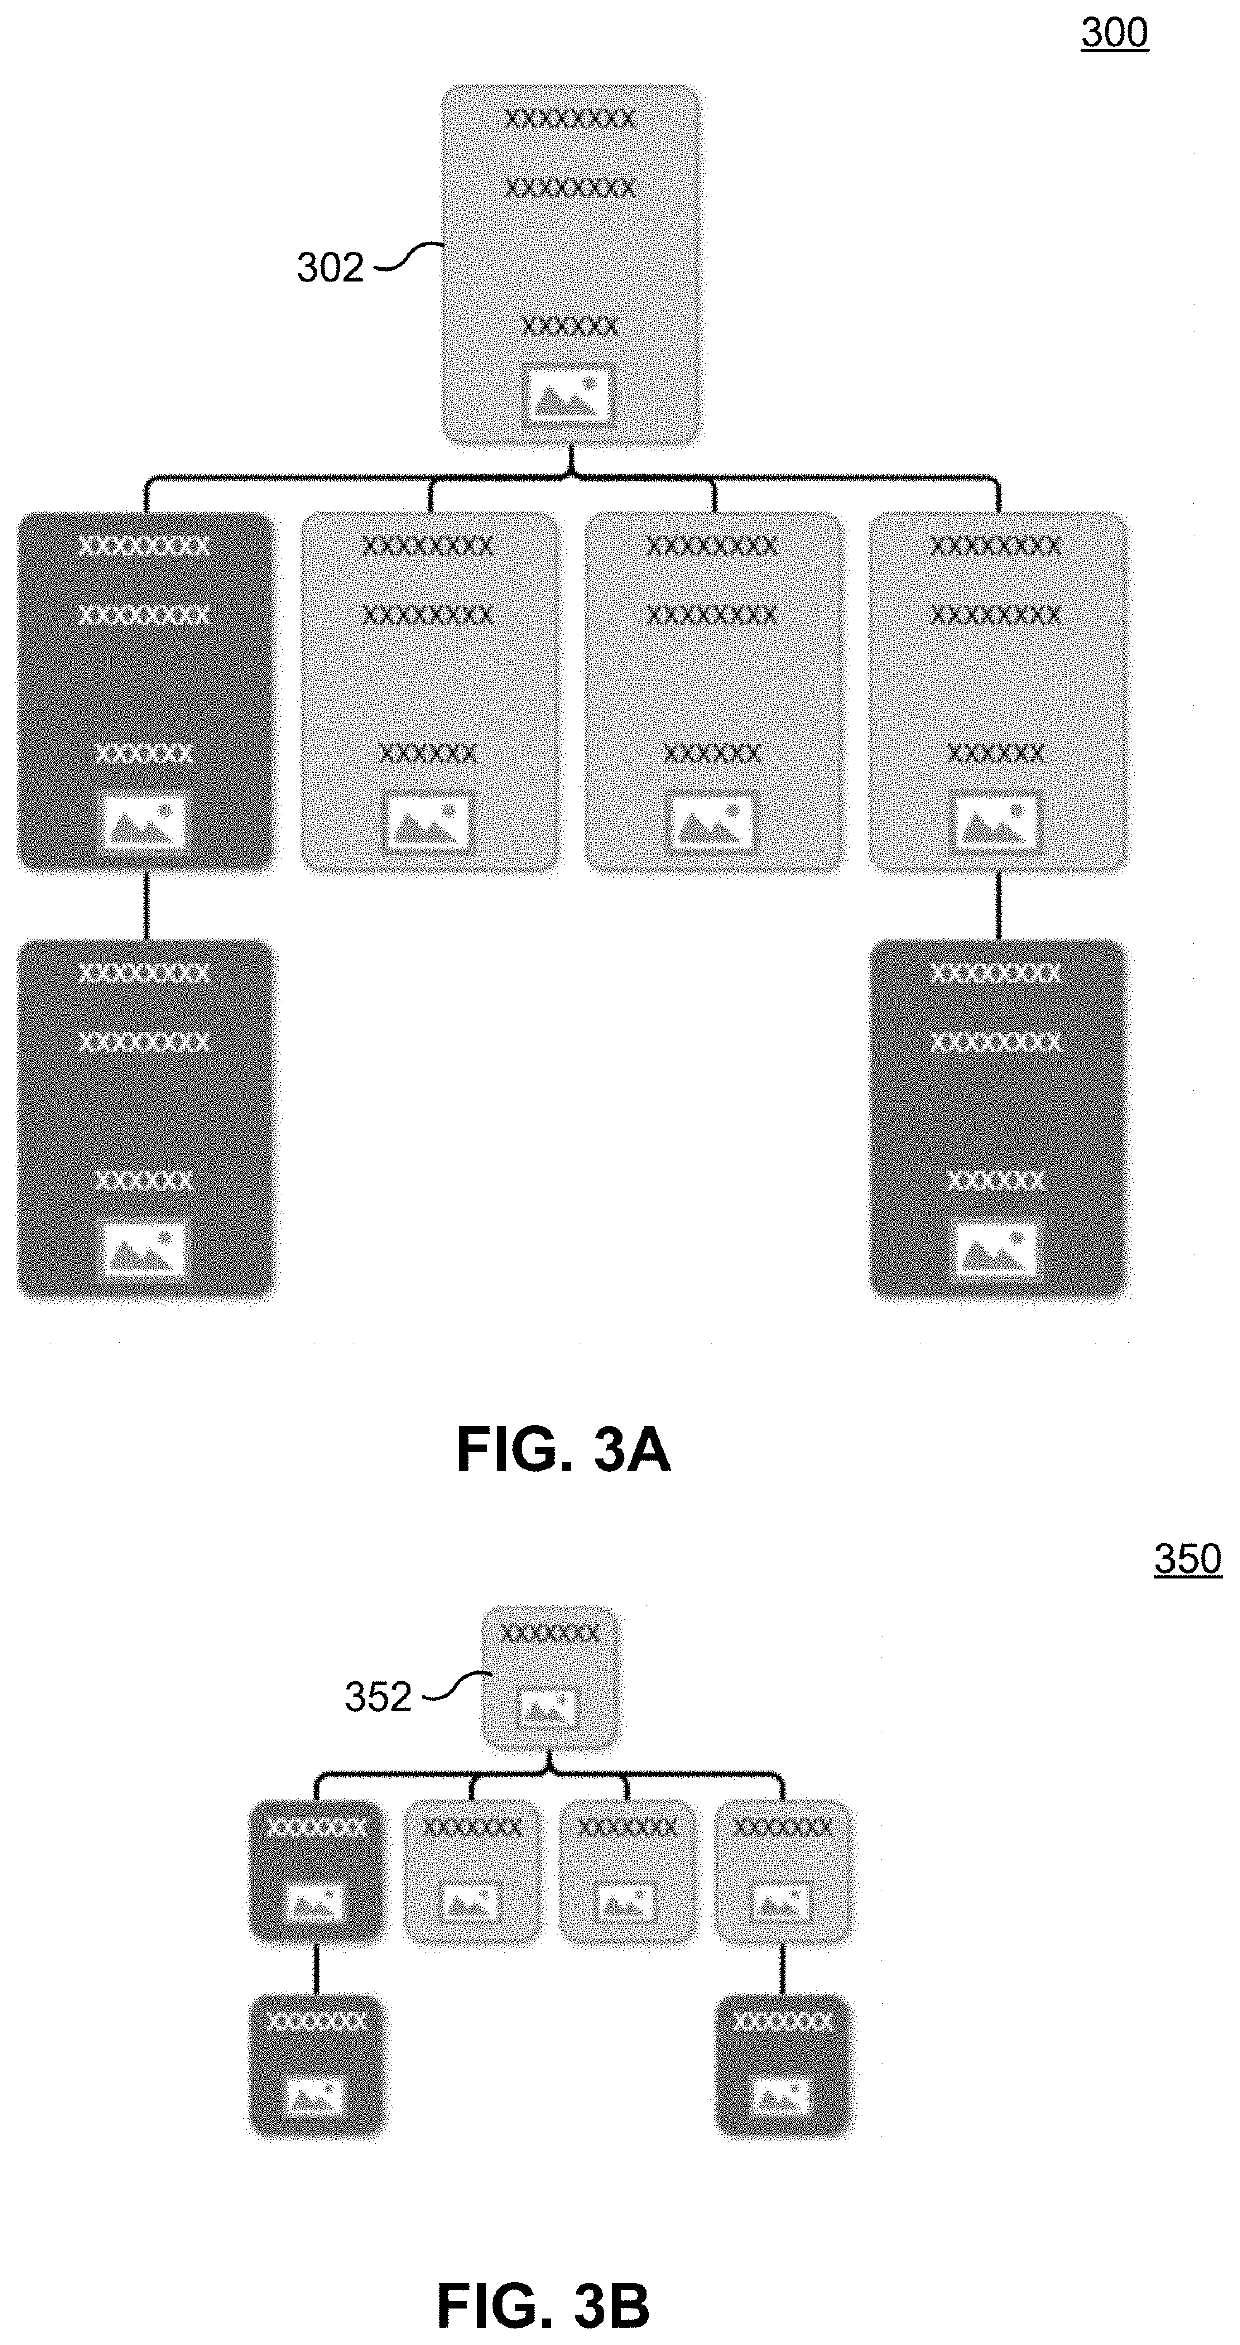
[0020]Embodiments provide methods and systems for generating graphical representation(s) of a plurality of hierarchical records. An exemplary graphical representation (also referred as “a tree” or “a graphical tree”) includes at least one parent, and hierarchical connections from the parent to its children. A given node in the graphical tree (e.g. a given record among the plurality of hierarchical records) may have more than one parent. There is no restriction on the number of children each node may have, as there is no restriction on the number of parents a given node may have. That is, a given node can have m parents (where m is 0 or more), and each node can have n children (where n is 0 or more). According to various embodiments, if a node has exactly one child, the child may be positioned directly below its parent node on a target output medium (e.g. a digital display, a paper).

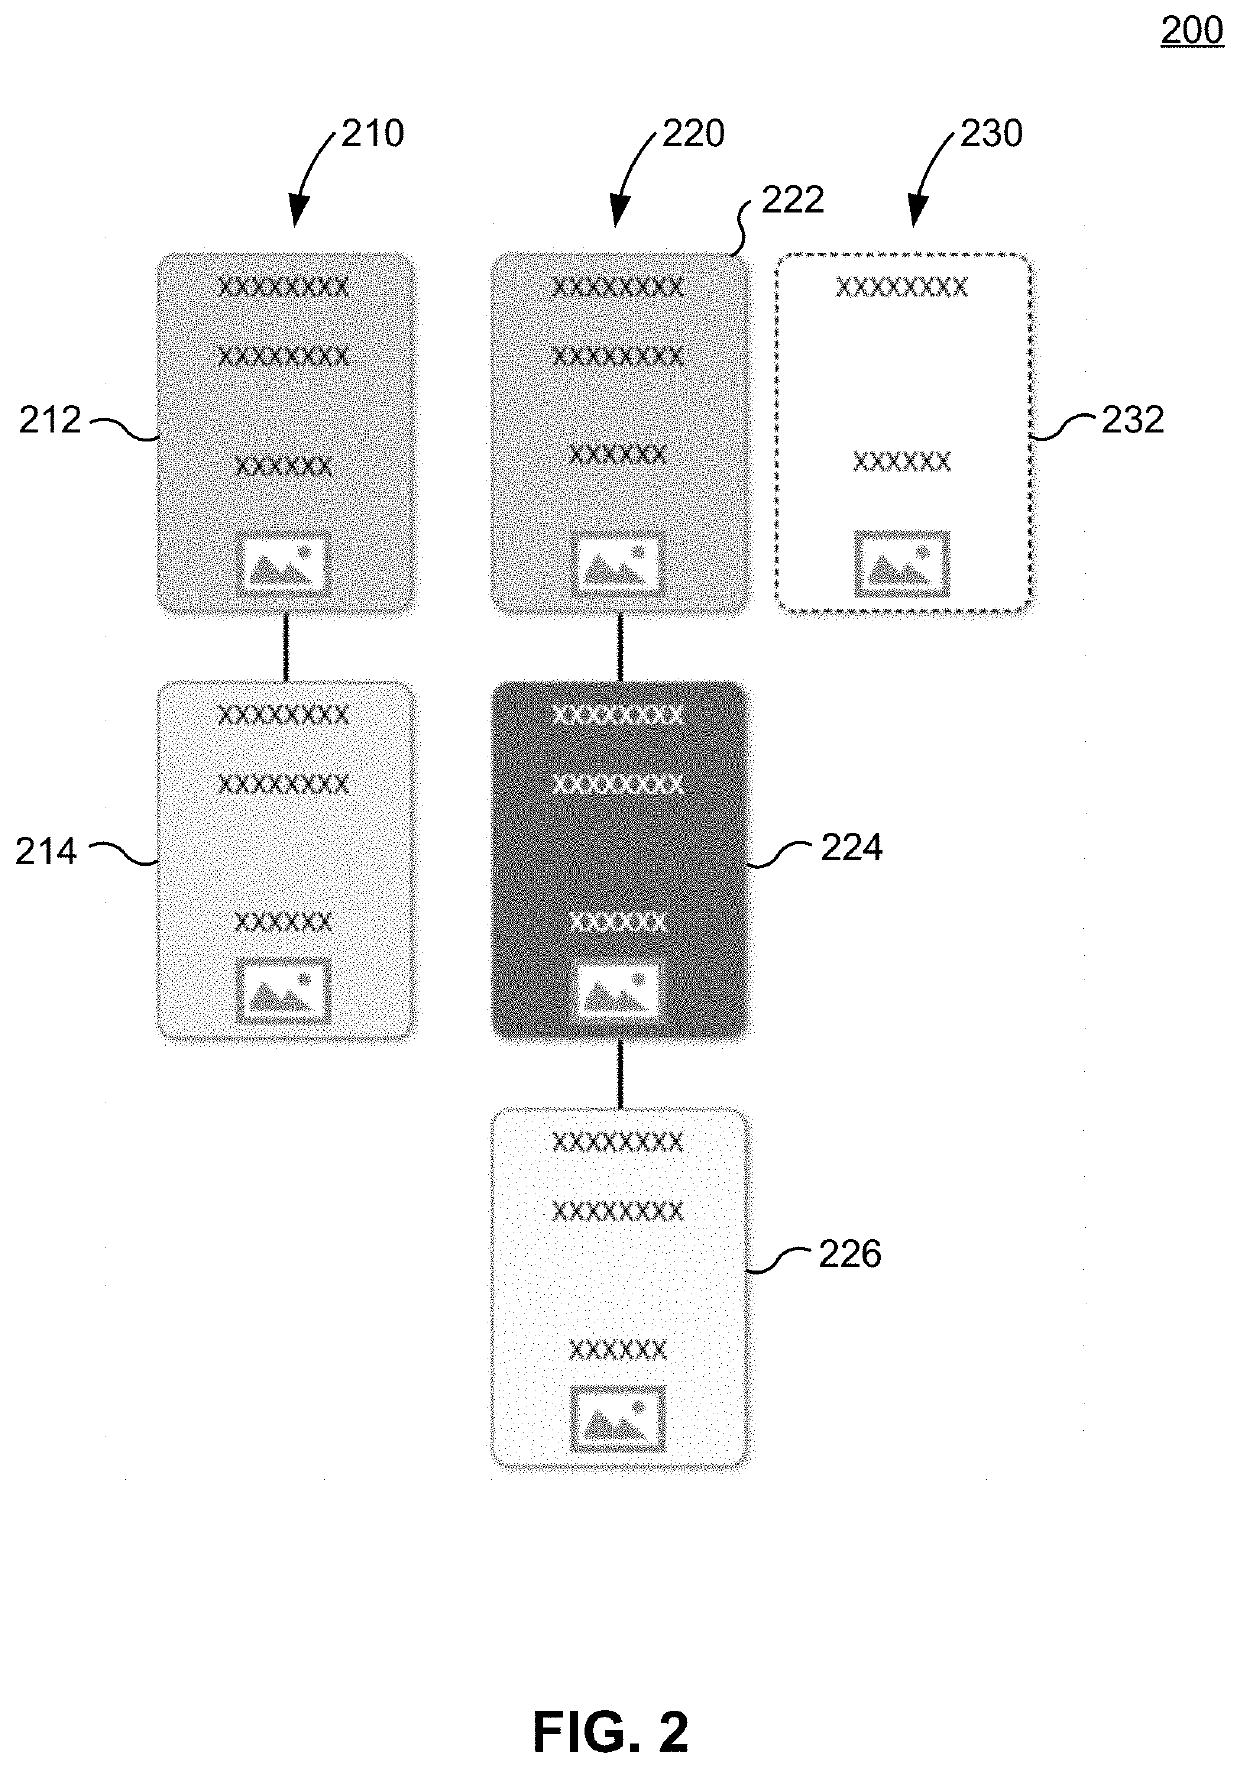
[0021]In some embodiments, a record with missing information may be identified and graphically illustr...


PUM


Abstract

Embodiments use a visual cue to identify a record with missing information among a plurality of hierarchical records. Each record includes a parent field and an associated records field. An entry in the parent field identifies a parent record of a given record. An entry in the associated records field identifies records that are associated with the record based on a criterion or one or more predetermined criteria. For a selected record, a first group of records are identified based on the parent field of the selected record. The entries in the associated records field of the selected record are then compared to the first group of records. A missing record missing an entry in the associated records field is identified among the first group of records. When the first record and the first group of hierarchical records are graphically represented on a target output medium, the missing record is represented using a visual cue.

Description

BACKGROUND[0001]A plurality of hierarchical records may be graphically represented using a graphical tree. graphical trees are a common method of visually representing a hierarchically-organized structure. Each node in the graphical tree may represent a given record among a plurality of hierarchical records, each connection between the nodes may represent a hierarchical relationship between the connected nodes. The graphical tree representations are expected to convey the hierarchical relationship information while conserving a visual aesthetic.[0002]The generation of a graphical tree begins with identifying all nodes and determining the placement (e.g. position) of each node on the display or output page. Previously, many graphical trees have been generated by a human graphic designer. Advancements in computer science resulted in developing node-positioning algorithms that calculate the x and y (e.g. x-y) coordinates for every node of the graphical tree. A rendering routine can the...

Claims


Application Information

Patent Timeline
Patent Type & Authority Applications(United States)
IPC IPC(8): G06F17/30G06F7/32
CPCG06F7/32G06F16/328G06F16/322G06F16/9038G06F16/93G06F16/34G06F16/9024
Inventor MATHISON, MARK P.
Owner KILPATRICK TOWNSEND & STOCKTON
Why Eureka
Try Eureka