
Software code debugger for quick detection of error root causes

a software code debugger and root cause technology, applied in the field of processing data, can solve problems such as cost to develop softwar

Active Publication Date: 2018-01-25
REVDEBUG COM SP ZOO
View PDF4 Cites 44 Cited by
  • Summary
  • Abstract
  • Description
  • Claims
  • Application Information

AI Technical Summary

Benefits of technology

The present patent is about a software code debugger tool that allows users to examine and bug-fix application code. This tool compiles and executes the code, recording the various states it goes through during execution. It provides a user interface for users to step through the code and examine it, using visual indicators to show which parts of the code are being executed and explaining the context of each state. The tool also allows users to change the code and re-run it for further analysis. The technical effect of this patent is a more efficient and effective way to develop and improve computer applications by identifying and locating bugs in the code.

Problems solved by technology

The costs to developing software are in part measured by how few errors are generated, and how quickly errors can be found.

Method used


Image

  • Software code debugger for quick detection of error root causes
  • Software code debugger for quick detection of error root causes
  • Software code debugger for quick detection of error root causes

Examples


example use cases

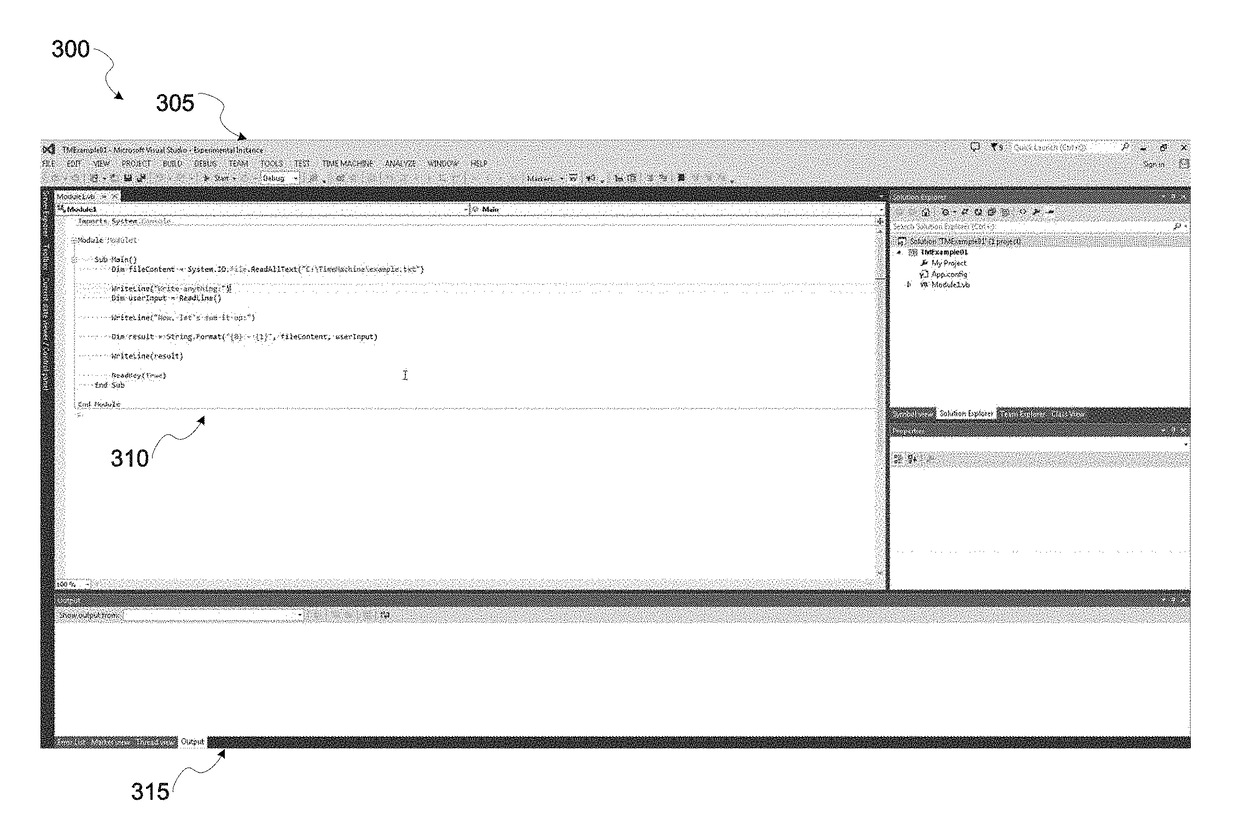
[0053]Referring to FIG. 3, illustration 300 shows an example programming environment for developing and debugging source code with the aid of the debugging tool of the present disclosures, according to some embodiments. In this example, a simple program comprising lines of source code 310 is being displayed in Microsoft Visual Studio environment 305. As some examples, the environment 305 includes a number of submenus at the top ribbon, various icons used for tracing through the source code 310, and an output window 315 that shows what outputs are being generated while the program of the source code 210 is run. In general, most of the environment 305 represents an example of a typical programming environment found in a number of conventional programming environments.

[0054]Referring to FIG. 4, illustration 400 includes additional functionality provided by the debugger tool, according to some embodiments. Here, for example, a new submenu 405 called “Time Machine,” is embedded as one of...

example implementation details

[0069]In some embodiments, analysis and instrumentation of the target application is made inside the compilation process pipeline. It is split and takes place in part during the parsing and lexing phase of the compilation process and also during lowering and generating debugging information phases of the compilation process.

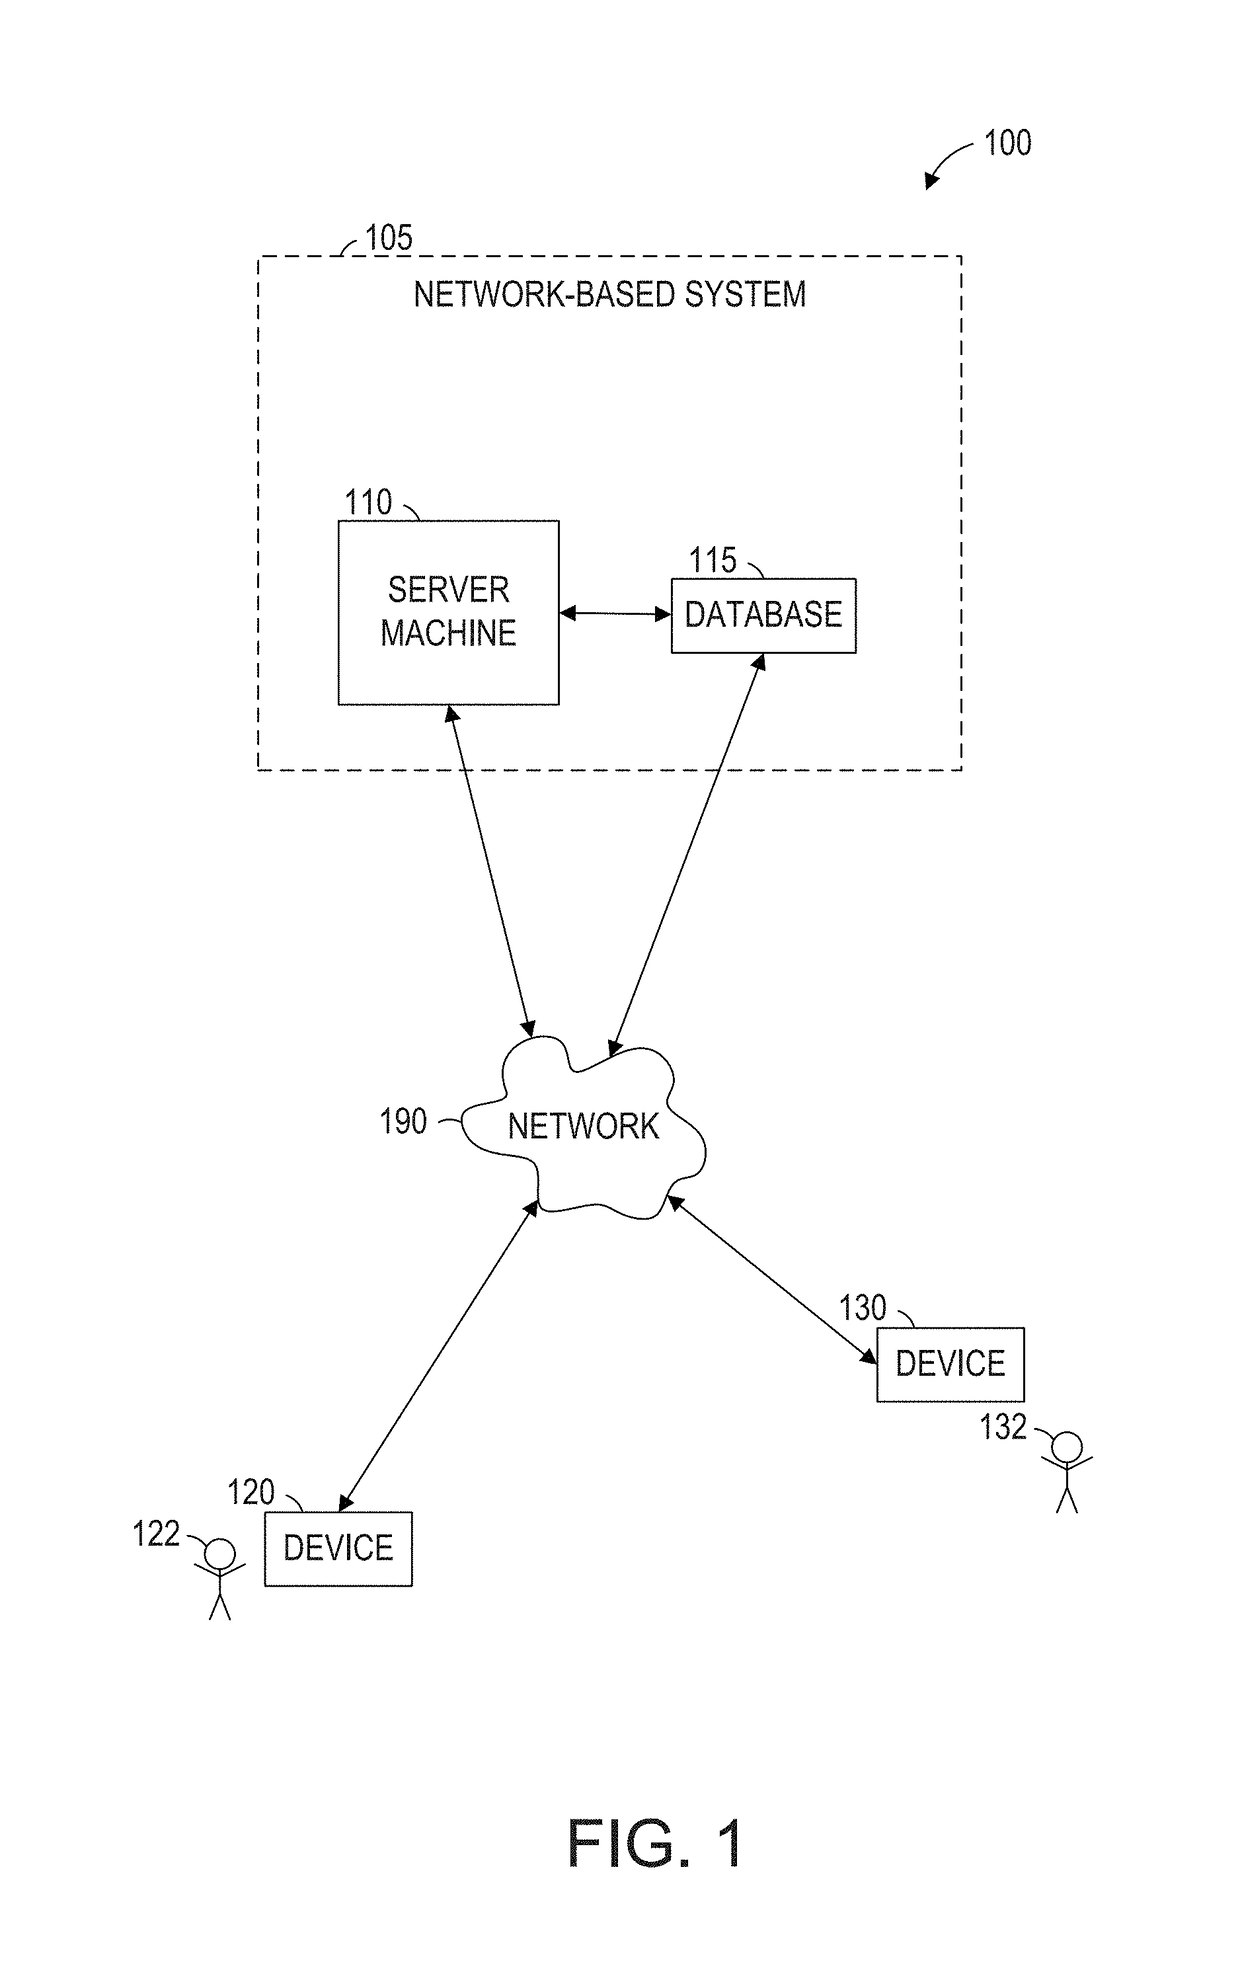
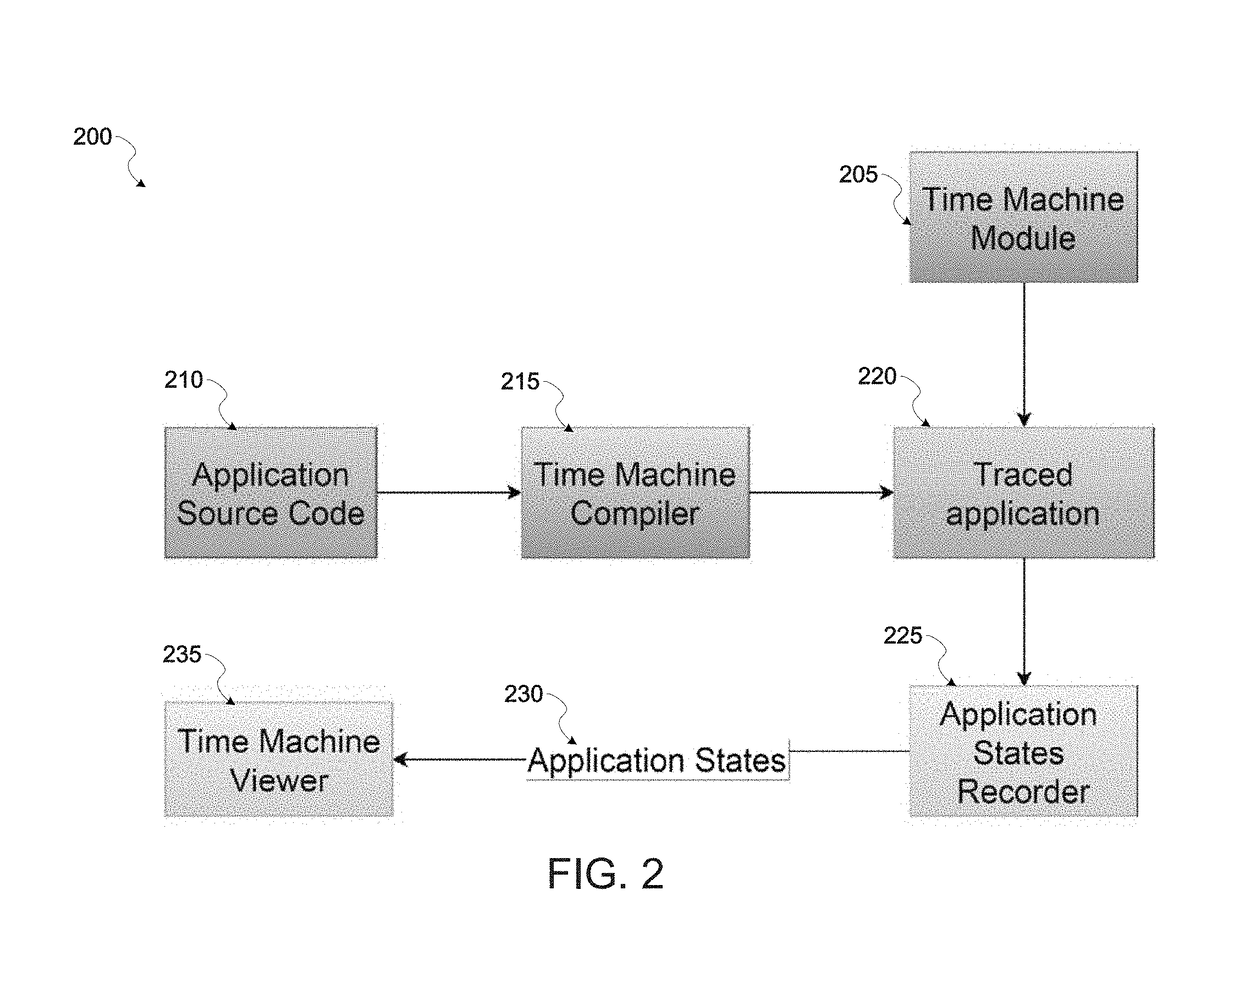
[0070]The analysis works on the Abstract Syntax Tree (AST) of the target application, and uses hints that are available during the lowering phase of the compilation process. The result is a modified—after lowering phase—AST and lowering metadata. Using the network based system 105, for example, to implement the architecture in FIG. 2, instrumenting the source code may be performed in a computer-implemented method in the following way, according to some embodiments:

[0071]1. Undoing some of the syntax-sugar to allow addition of recording statements into the code.

[0072]2. Enhancing classes to have their unique identifiers embedded. Shared code may be required to per...

example method

for Tracing and Recording States

[0136]FIGS. 13-17 provide support for an example process for generating the recorded states and various annotations described in the descriptions of the example use cases in FIGS. 3-12, according to some embodiments. The whole process is divided into two main phases. The first phase is compilation and building output files, which is performed by the compiler (see, e.g., RDB Compiler, FIG. 13 and FIG. 2). The second phase includes starting the application (e.g., executing the program of the source code), recording received states and viewing them. Both phases are separate from each other and can be done on different workstations (for example—application can be compiled and build on developer's computer, but it may be run on a tester's computer).

[0137]Phase one—compilation and building output

[0138]Before tracing the operations executed by an application of the source code, the application must be built, such as through the RDB Code Compiler (RDBCC) (see...


PUM


Abstract

Example methods, apparatuses, and systems are presented for a software code debugger tool. The code debugger tool may be configured to access source code intended to be examined for debugging. The debugger tool may compile the source code using a specially designed compiler that incorporates state recording functionality and other debugging functionality directly into the source code. When the source code is executed, the debugging tool may be configured to record a plurality of states that the application progresses through upon executing the application. The debugger tool can read recorded states while the application runs or after its execution. Various visual indicators may also provide additional annotations to aid in debugging, such as displaying the content of variables in a visual annotation showing their historical values, and providing a temporal status indicator to provide context to the user about what the present state represents in relation to specific functions in the source code.

Description

CROSS REFERENCE TO RELATED APPLICATION[0001]This application claims the benefit of U.S. Provisional Application No. 62 / 304,598, filed Mar. 7, 2016, and titled. “SOFTWARE CODE DEBUGGER FOR QUICK DETECTION OF ERROR ROOT CAUSES,” the disclosure of which is incorporated herein by reference in its entirety and for all purposes.TECHNICAL FIELD[0002]The subject matter disclosed herein generally relates to processing data. In some example embodiments, the present disclosures relate to methods for recording runtime states of an executed program compiled from source code in a software code debugger.BACKGROUND[0003]Debugging software is an essential practice for developing computer programs. Whole academic classes, books, software development teams, and software organizational structures have been dedicated to increasing the ease at which software errors can be found and easily rectified. The costs to developing software are in part measured by how few errors are generated, and how quickly err...

Claims


Application Information

Patent Timeline
Patent Type & Authority Applications(United States)
IPC IPC(8): G06F11/36G06F9/45
CPCG06F11/3664G06F11/3644G06F8/447G06F8/41G06F8/51G06F11/3624G06F11/323
Inventor KRUSZEWSKI, TOMASZKRUSZEWSKI, ADAM
Owner REVDEBUG COM SP ZOO
Learn More