
System and Method for Visual Analysis of Event Sequences

a visual analysis and event sequence technology, applied in the field of visual analysis of event sequences, can solve the problems of limited tools, lack of visual interfaces and functionality to visualize and analyze the sequence of records, and existing sequence analysis tools that do not incorporate the concept of time between events

Active Publication Date: 2018-01-18
ABBYY DEV INC
View PDF7 Cites 13 Cited by
  • Summary
  • Abstract
  • Description
  • Claims
  • Application Information

AI Technical Summary

Benefits of technology

The present invention is about a system and method for analyzing large sets of event sequences, which are commonly referred to as "big data," by using a visual analysis application. The system can receive data from various sources and convert it into event sequences, calculate metrics for the sequences, and display them on a user interface. The user interface allows users to sort, color-code, or highlight specific events within the sequences. The system can also use machine learning to automatically group and order the event sequences based on predetermined criteria. The technical effects of this invention include improved understanding of business processes, better analysis of event sequences, and improved visualization of data.

Problems solved by technology

Such tools are limited in that they do not provide visual interfaces and functionality to visualize and analyze the sequences of records.
Thus, existing sequence analysis tools do not incorporate the concept of time between events.
Also, because of a very large number of elements in a single sequence, these tools rely on mathematical algorithms rather than a visual analysis to discover the patterns and deviations.

Method used


Image

  • System and Method for Visual Analysis of Event Sequences
  • System and Method for Visual Analysis of Event Sequences
  • System and Method for Visual Analysis of Event Sequences

Examples


example architecture

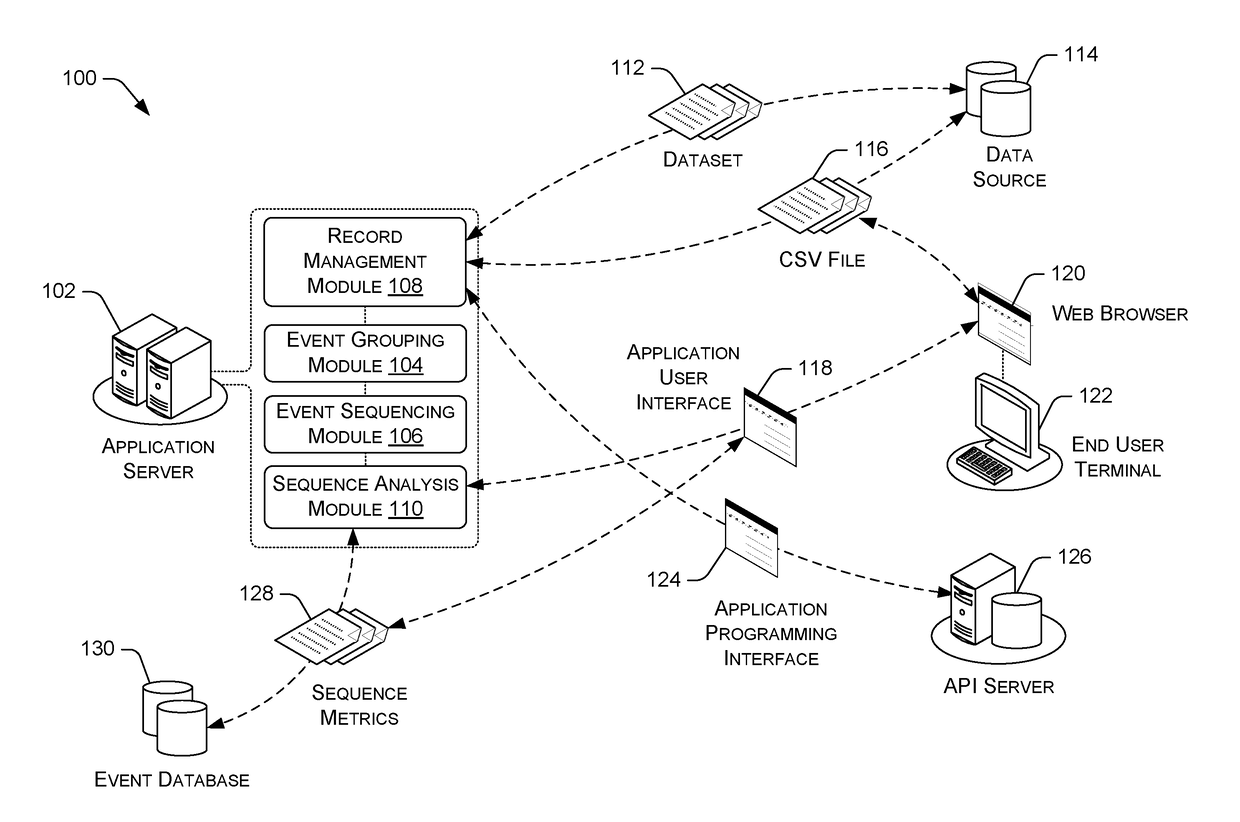
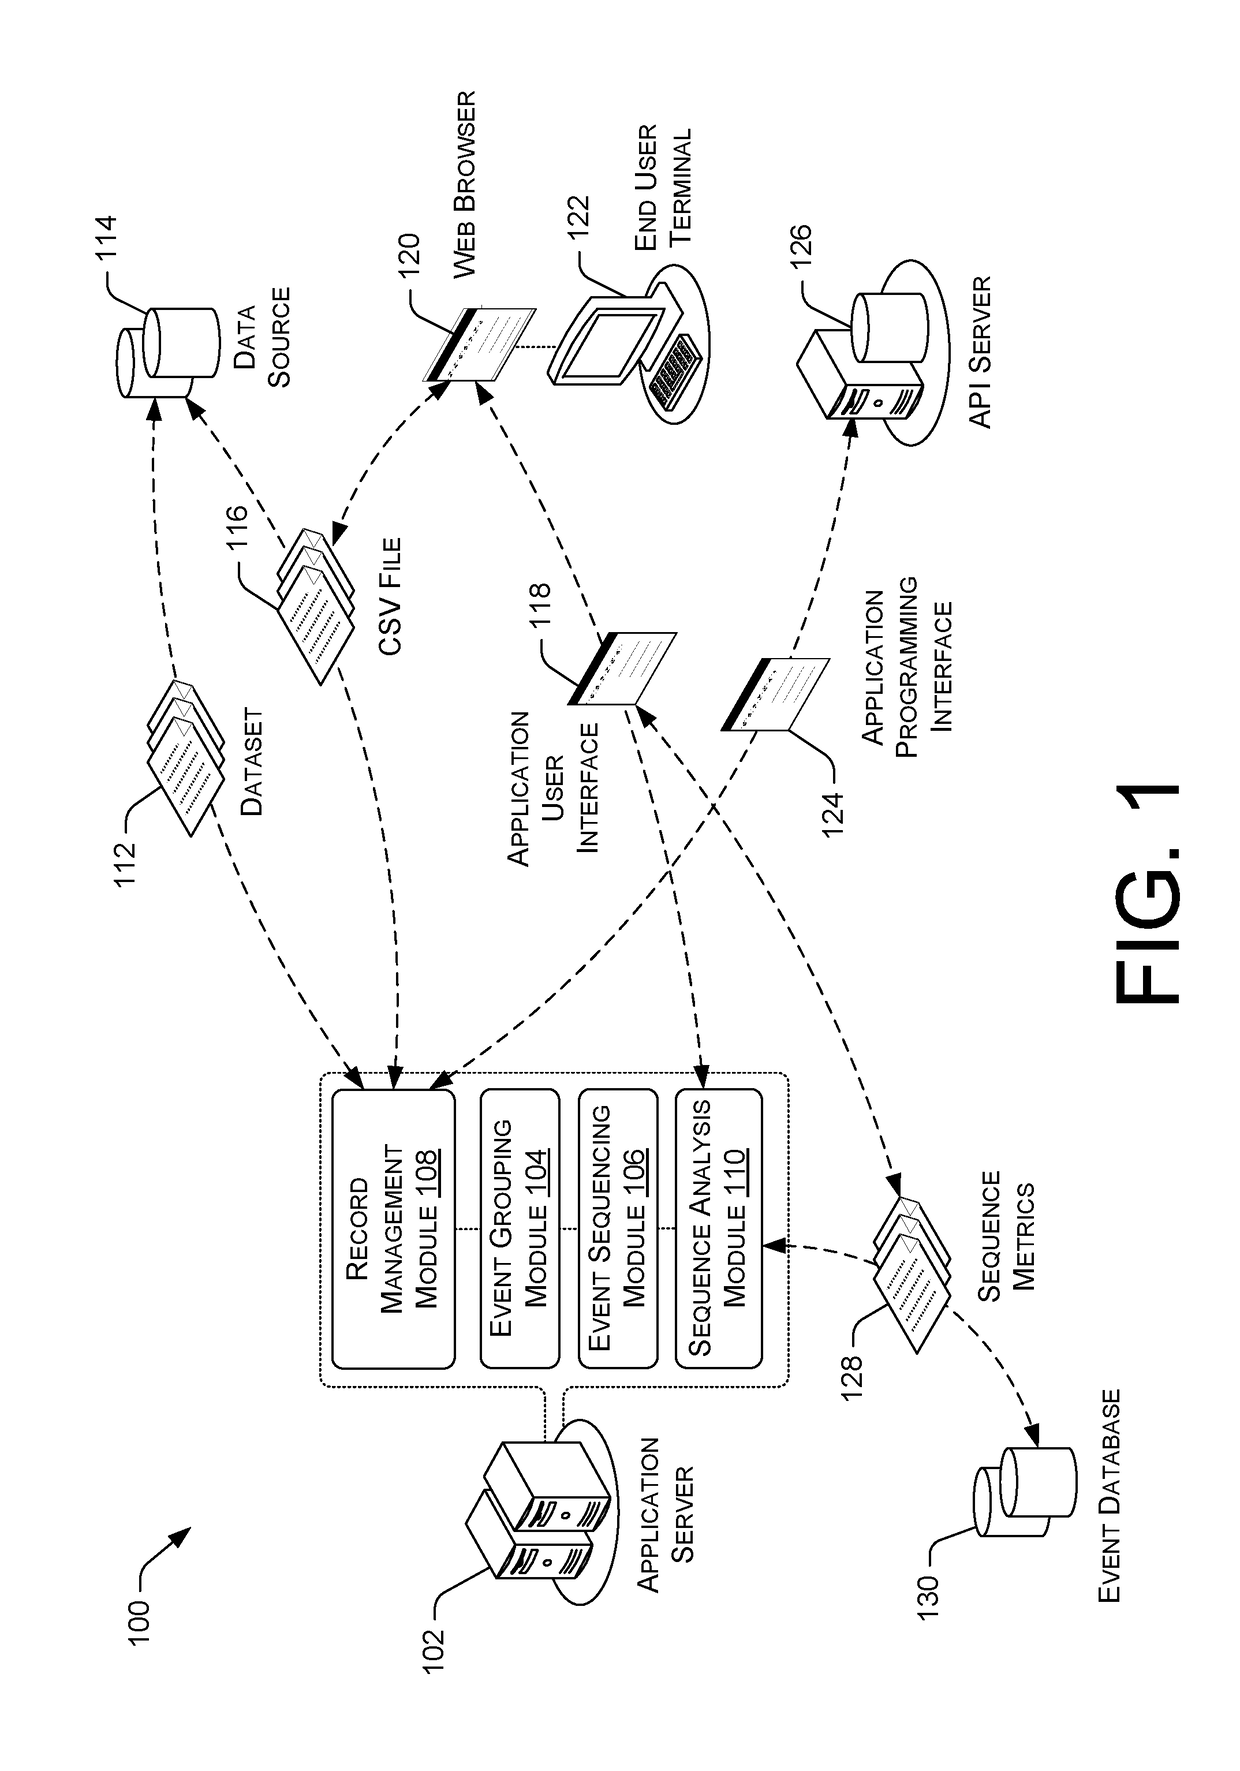
[0015]FIG. 1 illustrates example architecture for providing a visual analysis of event sequences. In one embodiment, the system 100 comprises a network-enabled (i.e., for connection to the Internet, LAN, etc.) computer system, for example, an end user terminal 122 that is operated by an end user. In various embodiments, the end user terminal 122 can include general-purpose computers, mobile handsets, smartphones, tablet computers, personal digital assistants (PDAs), smart watches, and / or other electronic devices. The end user terminal 122 can access an event sequencing application using a web browser 120, wherein the application comprises an application user interface 118 and can reside at least in part on the end user terminal 122, depending upon the embodiment. In various embodiments, the application can be executed in a web browser 120 and is configured to read various data files and transmit the content of the data files to and from various components of the system100. The event...

example processes

[0045]FIG. 9 presents illustrative process 900 for using the event sequencing application to conduct a visual analysis of event sequences. The process 900 is illustrated as a collection of blocks in a logical flow chart, which represents a sequence of operations that can be implemented in hardware, software, or a combination thereof. In the context of software, the blocks represent computer-executable instructions that, when executed by one or more processors, perform the recited operations. Generally, computer-executable instructions may include routines, programs, objects, components, data structures, and the like that perform particular functions or implement particular abstract data types. The order in which the operations are described is not intended to be construed as a limitation, and any number of the described blocks can be combined in any order and / or in parallel to implement the process. For discussion purposes, the process 900 is described with reference to FIGS. 1 thro...


PUM


Abstract

Techniques are disclosed for creating event sequences from event data and then providing a visual analysis of event sequences. An event sequencing application analyzes event-related data in order to group events in accordance with predetermined grouping criteria and to sort the events in a chronological order to generate the event sequences. The event sequencing application further provides calculated sequence-specific metrics and a visual representation of event sequences for an event set, thus allowing a user to sort, filter, query, and perform various other types of analysis over the event sequences

Description

CROSS REFERENCE TO RELATED PATENT APPLICATIONS[0001]This application claims priority to U.S. Provisional Patent Application No. 62 / 363,377, filed Jul. 18, 2016, and entitled “System and Method for Visual Analysis of Event Sequences,” which is hereby incorporated by reference in its entirety.FIELD OF THE INVENTION[0002]The present invention relates generally to visually analyzing event sequences. More particularly, the present invention is directed to a system and method for providing a visual analysis of large and diverse sets of event sequences by calculating and displaying sequence-specific metrics for an event set, displaying a representative sample of the set, and allowing end users to reduce the set based on the values of the metrics.BACKGROUND OF THE INVENTION[0003]Many business processes, whether human-driven, automated or a combination thereof, comprise multiple events happening over a period of time. An event, as described herein, is a computer-recorded fact that a particul...

Claims


Application Information

Patent Timeline
IPC IPC(8): G06F19/00G06F17/28G06F17/30G06N5/02
CPCG06F19/327G06F17/30713G06F17/2881G06N5/025G16H10/20G16H10/60G06F16/2474G06F16/26G16H40/20G06N20/00G06N7/01G06F16/358G06F40/56
Inventor OPITZ, SCOTTELKIN, ALEX
Owner ABBYY DEV INC
Learn More