
Method for performing automated analysis of sensor data time series

a technology of sensor data and time series, applied in the direction of probabilistic networks, inference methods, instruments, etc., can solve the problem of nevertheless computationally expensiv

Active Publication Date: 2018-01-11
GREENWAVE INNOVATIONS INC
View PDF0 Cites 26 Cited by
  • Summary
  • Abstract
  • Description
  • Claims
  • Application Information

AI Technical Summary

Benefits of technology

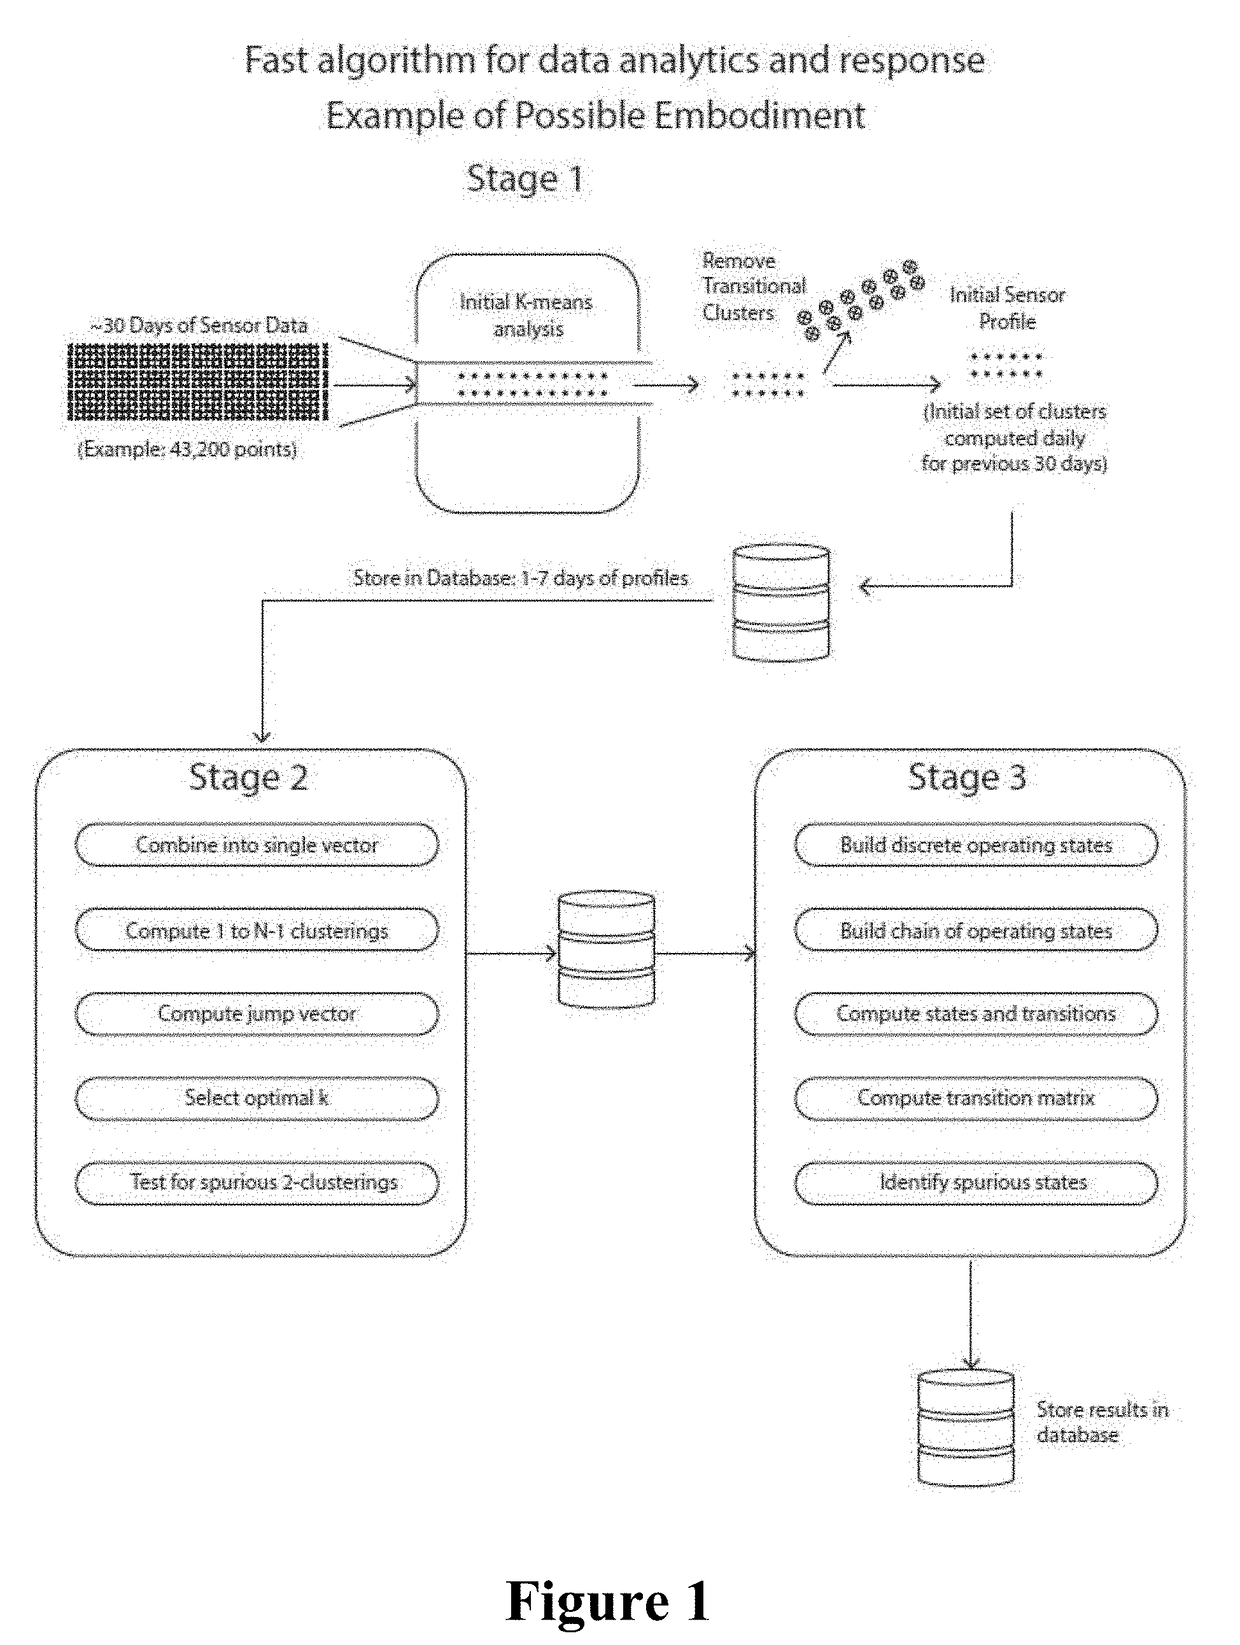
The present invention provides a method of analyzing large volumes of data using k-means clustering, which can be time-consuming and expensive. The method takes advantage of the fact that centroids from an initial, expensive clustering can be used as proxies for the data points to approximate an optimal clustering, which can be processed in a fraction of the time. This reduces the size of the problem and makes the analysis faster and more efficient. The method can be extended to clusters with different probability distribution types as long as they meet certain statistical properties.

Problems solved by technology

K-means clustering is an NP-hard problem, meaning that it cannot be solved except by applying the brute force approach of trying every possible clustering for the number of clusters K. Heuristic algorithms such as Lloyd's Algorithm and k-means++ work well but they are nevertheless computationally expensive.
If n is large, this is very expensive.
However, by using the centroids from an initial, expensive clustering as proxies for the data points, an approximation of an optimal clustering can be determined that may be processed in a fraction of the time of the initial clustering.

Method used


Image

  • Method for performing automated analysis of sensor data time series
  • Method for performing automated analysis of sensor data time series
  • Method for performing automated analysis of sensor data time series

Examples


Embodiment Construction

[0019]The present invention uses a fast algorithm for automated analysis of time series sensor data.

[0020]The algorithm was developed for electric circuit analysis but can easily be extended to other types of sensor data, including flow meters, temperature and weather data, air quality sensors, and so on.

[0021]In k-means clustering given a set of n data points in a d-dimensional space, the problem is to find a cluster of k points, called centroids, that minimize the mean squared distance from each data point to its nearest centroid. In practical terms, the problem is to determine clusters of observations that represent normal equipment operating states.

[0022]To analyze sensor data in terms of operating states one first needs to establish the optimal value for k; in other words, one needs to know how many operating states there are. In an arbitrary vector of sensor data the optimal number is unknown. Several heuristic optimality algorithms are known. One such method for establishing ...


PUM


Abstract

A method using a fast algorithm automated analysis of time series sensor data that can find an optimal clustering value k for k-means analysis by using statistical analysis of the results of clustering for a stated maximal upper value of k.

Description

CROSS REFERENCE TO RELATED APPLICATION[0001]This application claims the benefit of provisional application, U.S. Ser. No. 62 / 190,317, filed Jul. 9, 2015 and currently pending, entitled METHOD FOR PERFORMING AUTOMATED ANALYSIS OF SENSOR DATA TIME SERIES, by Curtis Meadow, which is hereby incorporated by reference.BACKGROUND OF THE INVENTION1. Technical Field[0002]The present invention relates to a method comprising, in one embodiment, an ultra-fast software-based algorithm operating on high volumes of real time data to find patterns that may indicate improper equipment activity. It can be used for other purposes including, but not limited to, monitoring of time spent in a running state in order to indicate when maintenance is due; analyzing operating efficiency over time; and finding ways to operate equipment more efficiently.2. Description of Prior Art[0003]Data is gathered in real time with regard to the operation of a piece of equipment, such as a refrigeration unit. The data can ...

Claims


Application Information

Patent Timeline
IPC IPC(8): G06N5/04G06N99/00G06N7/00
CPCG06N5/047G06N7/005G06N99/005G06N7/01
Inventor MEADOW, CURTIS
Owner GREENWAVE INNOVATIONS INC
Learn More