
Road Density Calculation

a technology of road density and calculation method, applied in surveying, navigation, instruments, etc., can solve problems such as errors and ambiguities in techniques, inaccurate positioning data, and inability to match maps in all directions

Active Publication Date: 2017-05-25
HERE GLOBAL BV
View PDF10 Cites 16 Cited by
  • Summary
  • Abstract
  • Description
  • Claims
  • Application Information

AI Technical Summary

Benefits of technology

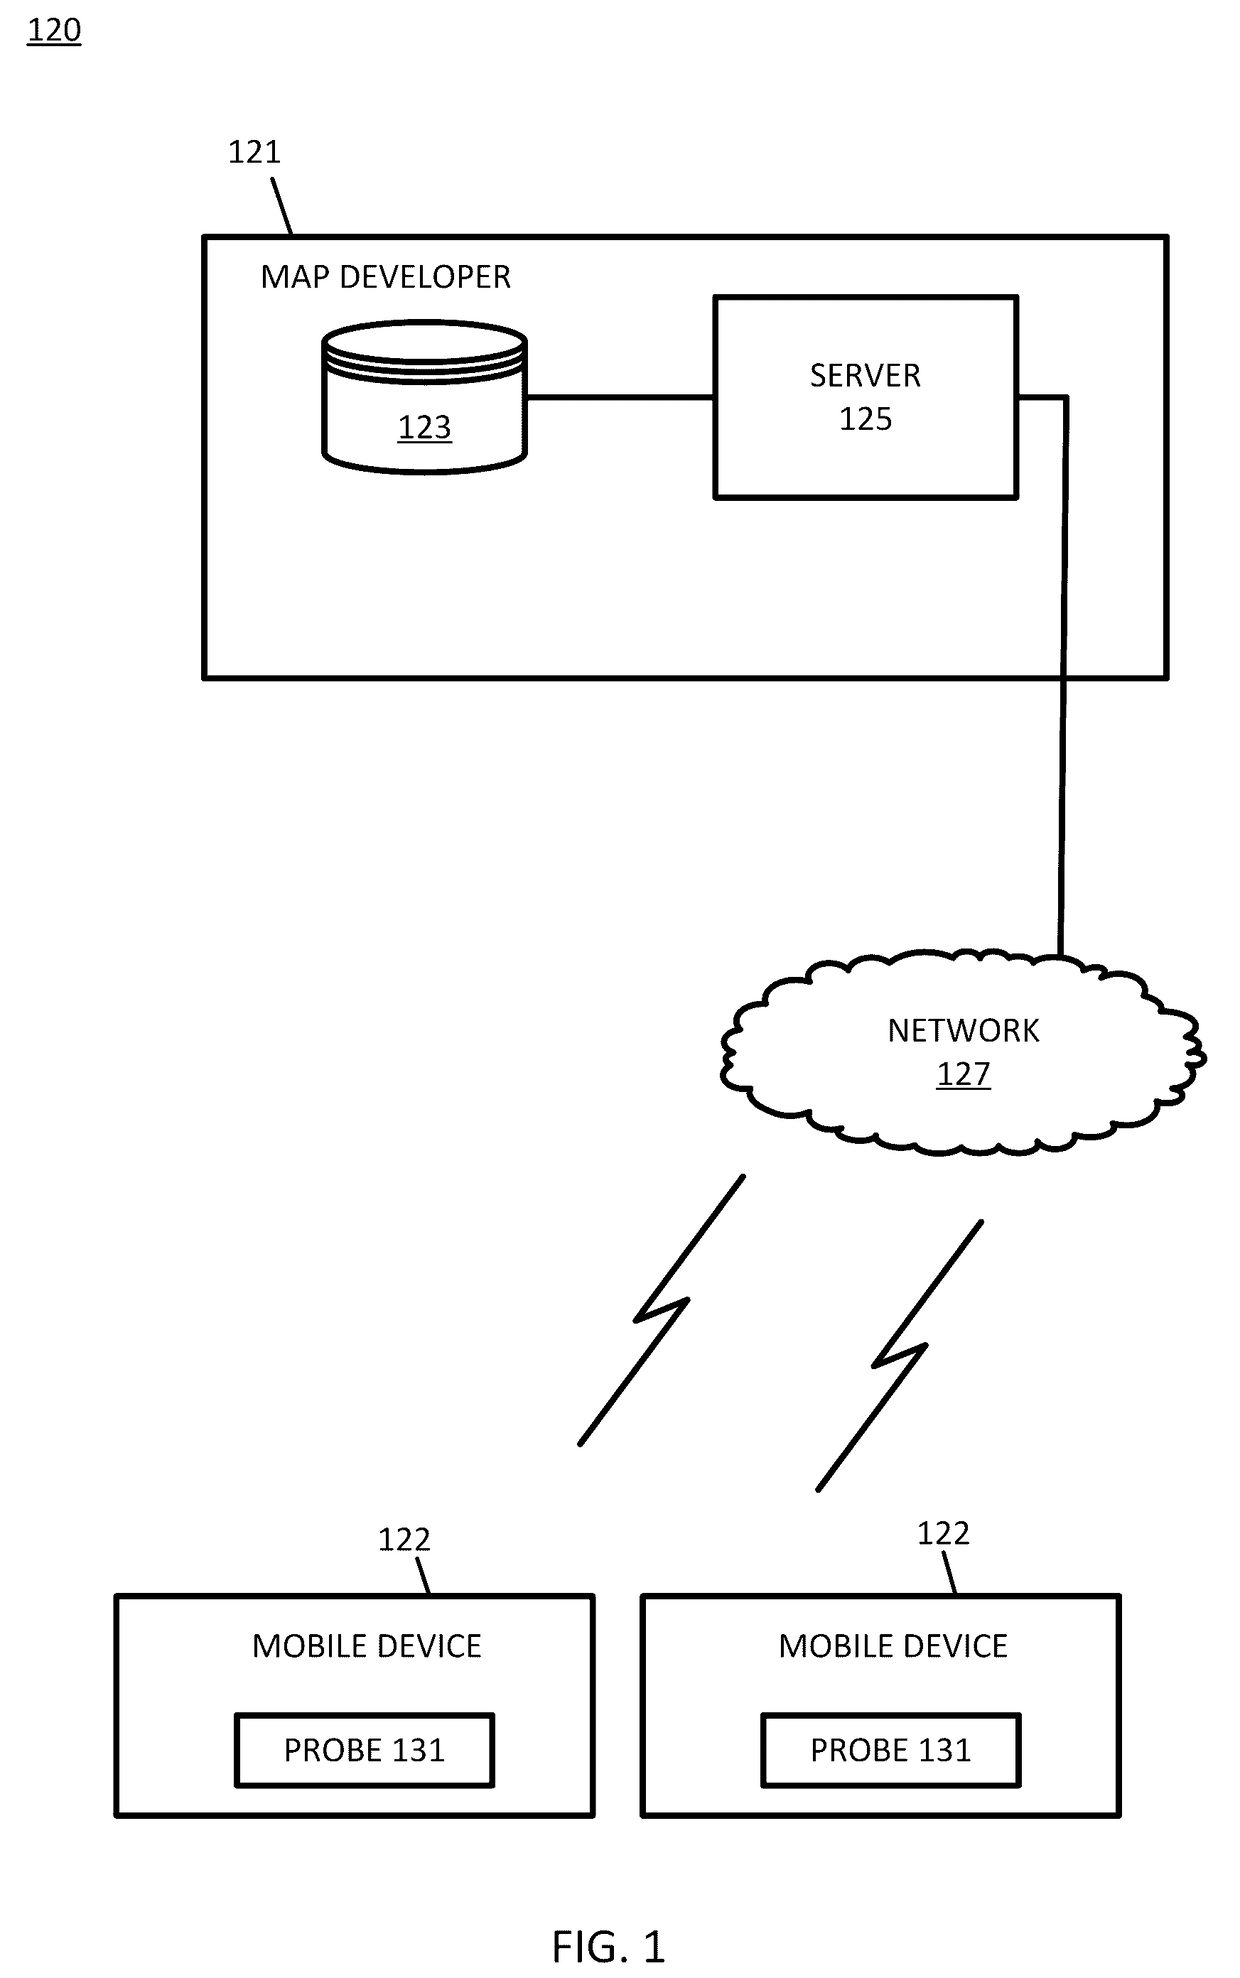
The patent describes a system and method for identifying road segments in a map region and measuring distances from points in the region to the closest road segment. The system calculates a road density value based on the distances and a map matching parameter that is proportional to the inverse of the average distance. This allows for more accurate matching of road segments based on a user's location. The system can use this information to provide navigation commands or driving commands based on the matched road segment.

Problems solved by technology

Service providers and device manufacturers (e.g., wireless devices, cellular devices, and computers) are continually challenged to deliver value and convenience to consumers by, for example, providing compelling network services.
However, positioning data is inaccurate due to errors caused by technical as well as environmental factors.
Map matching techniques are not equally successful in all areas.
Some techniques are susceptible to errors and ambiguity because the physical surroundings of road segments are not taken into account.
Accordingly, service provider and device manufacturers face significant technical challenges associated with mapping probe data points to road segments.
However, using any of these metrics for road density, no distinction is made based on how the roads are distributed in the area.
The urban area may be susceptible to electrical interference or noise or to reflection from object such as high buildings.
Consequently, the cost of acquiring, aggregating, or organizing probe data may vary depending on the source of the probe data.
For rural settings, the probe data 172 (high accuracy) may be more expensive but not provide any create confidence in the map matching application than probe data 182 (low accuracy).
Additionally, the illustrations are merely representational and may not be drawn to scale.

Method used

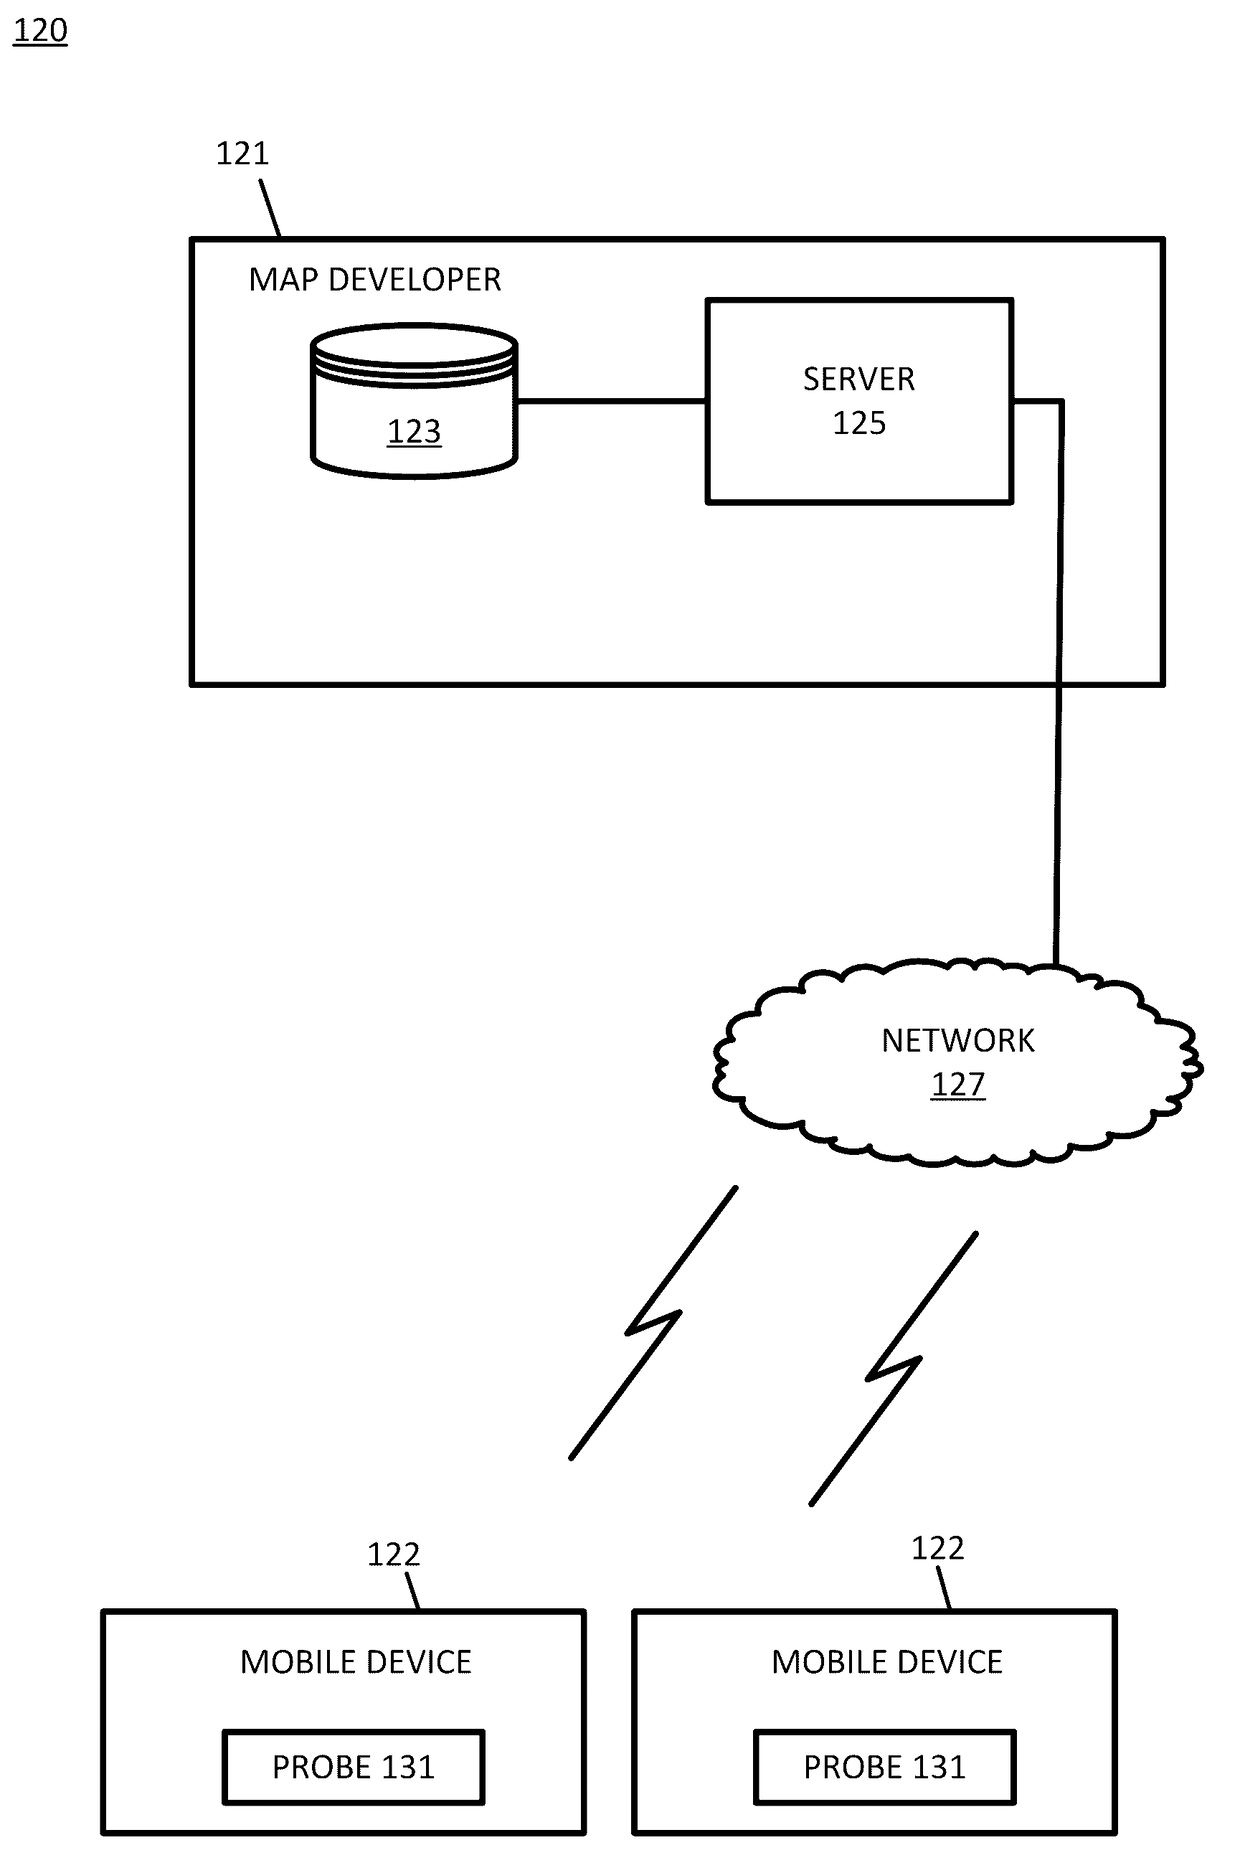

Image

  • Road Density Calculation
  • Road Density Calculation
  • Road Density Calculation

Examples


example classification

[0032 systems that may be assigned numeric values for functional class. The functional class of the road segment may be described as a numerical value (e.g., 1, 2, 3, 4, and 5) represented in the feature vector. Functional class 1 may be highways while functional class 5 may be small streets. Table 1 further illustrates schemes having three to six functional classes.

[0033]One example of a simple system includes the functional classification maintained by the United States Federal Highway administration. The simple system includes arterial roads, collector roads, and local roads. The functional classifications of roads balance between accessibility and speed. An arterial road has low accessibility but is the fastest mode of travel between two points. Arterial roads are typically used for long distance travel. Collector roads connect arterial roads to local roads. Collector roads are more accessible and slower than arterial roads. Local roads are accessible to individual homes and bus...


PUM


Abstract

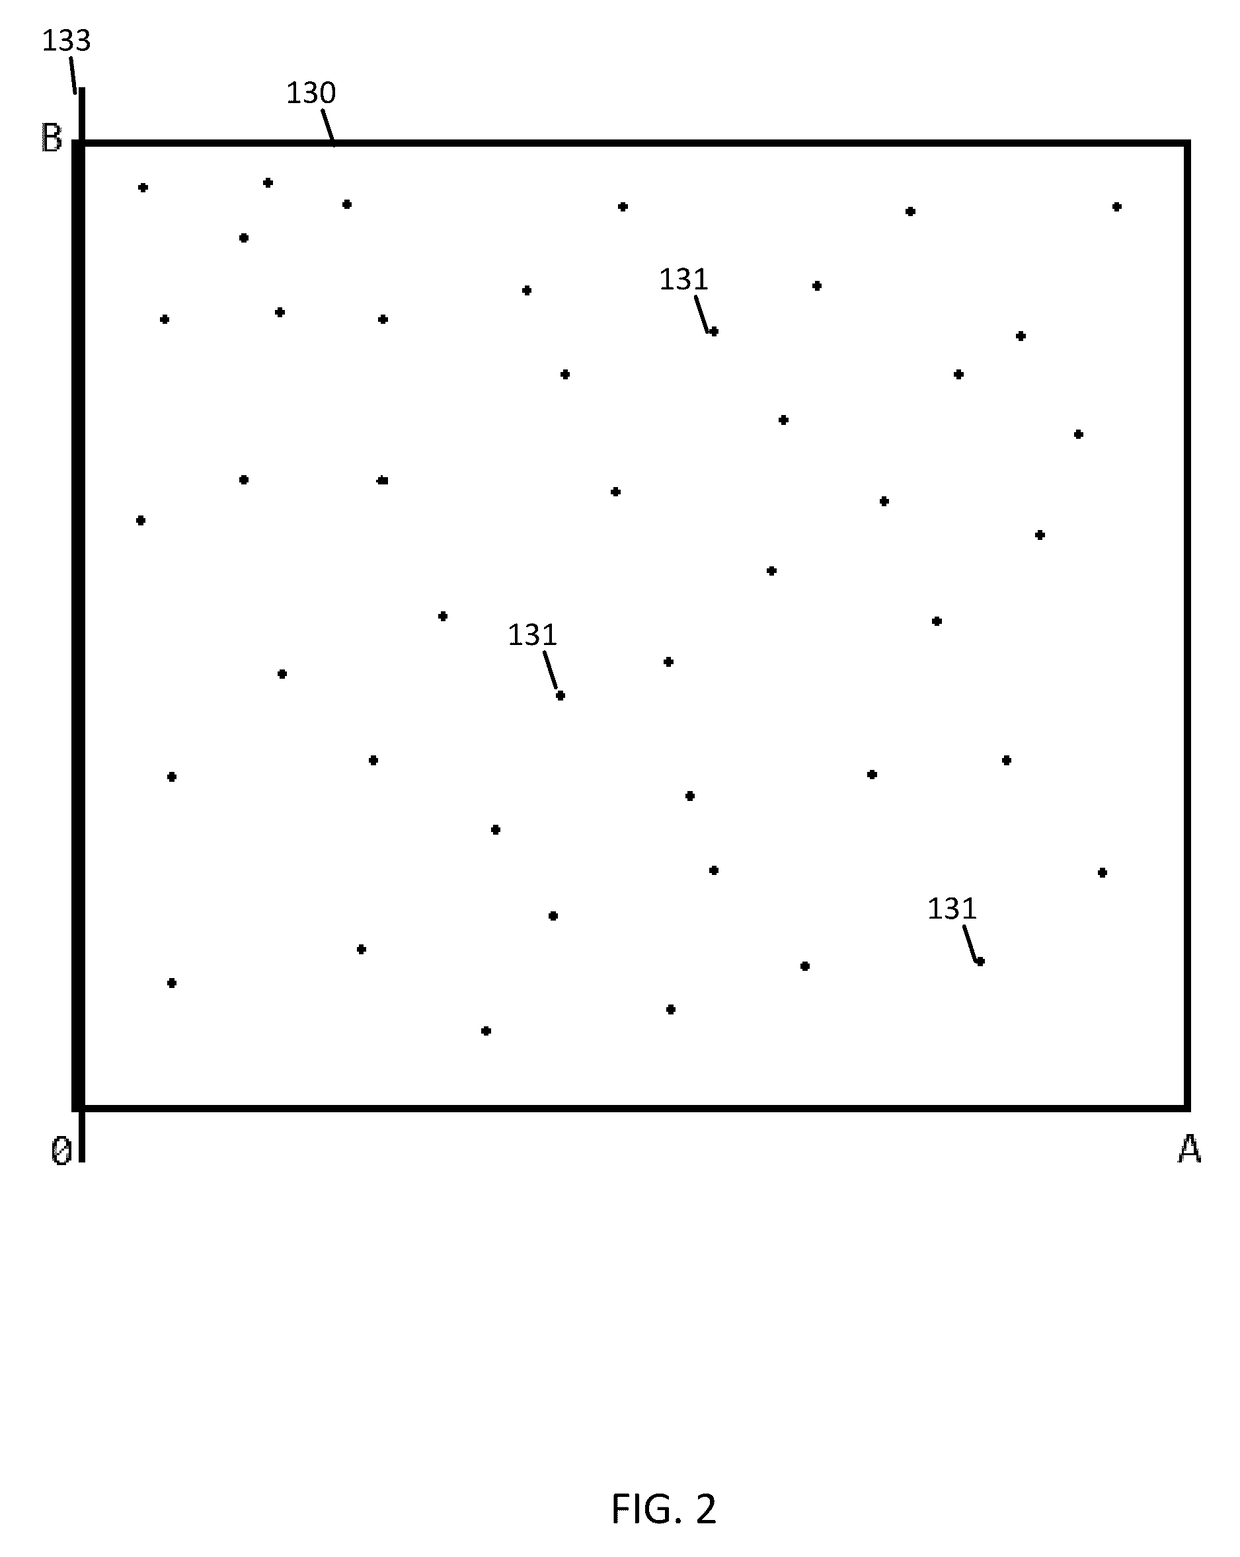
A map region is analyzed by a mobile device or by a server. The map region including one or more road segments is identified. Multiple points are selected from the map region. From each of the selected points, a distance is measured from the selected point to a nearest road segment of the one or more road segments. A road density value is determined from the distances. The road density value may be based on an average of the distances. In one example, the road density value is an inverse of the average of the distances. The road density value may be a parameter for matching subsequent probe points to a road segment in the map region.

Description

FIELD[0001]The following disclosure relates to a road density calculation, and more particularly, a road density calculation based on relative positions of roads in an area.BACKGROUND[0002]Service providers and device manufacturers (e.g., wireless devices, cellular devices, and computers) are continually challenged to deliver value and convenience to consumers by, for example, providing compelling network services. Many of these services rely on accurately determining the position of these consumers in order to match them to map data. However, positioning data is inaccurate due to errors caused by technical as well as environmental factors. Thus, map matching requires repositioning the inaccurate probe data in order to match it to the correct map features.[0003]For services such as route navigation, the probe data point must be repositioned to the correct road segment. Map matching techniques are not equally successful in all areas. Some techniques are susceptible to errors and ambi...

Claims


Application Information

Patent Timeline
Patent Type & Authority Applications(United States)
IPC IPC(8): G01C21/36
CPCG01C21/3667G01C21/3679G01C21/30
Inventor AVERBUCH, ALEX
Owner HERE GLOBAL BV
Learn More