
System, Apparatus and Method for Mapping

a mapping system and map technology, applied in the field of cartography, can solve the problems of low density of built-up population and human activity, high land consumption, and inability to sustain mass transportation

Inactive Publication Date: 2011-03-31
1626628 ONTARIO LTD
View PDF11 Cites 15 Cited by
  • Summary
  • Abstract
  • Description
  • Claims
  • Application Information

AI Technical Summary

Benefits of technology

It is an object of the present invention to provide a novel method and system for mapping that obviates or mitigates at least one of the above-identified disadvantages of the prior art.

Problems solved by technology

This condition, in which the majority of North Americans, for example, now live in suburbs with low rates of built density and human activity, is generally unable economically to sustain mass transportation.
Residence, work, shopping and leisure are not only low in density, and highly land consuming, but activities are generally segregated and separate.
In consequence, there is now widespread concern for the effects of such dependence on the automobile—in air pollution, greatly increasing delays, in the increasing aggregate traveling that decreases the quality of peoples lives in costs, time and difficulties in getting to jobs, and in many other respects.
Regardless of the chosen approach, one problem with prior art urban mapping and data collection techniques is that there is little in the way of hard-data that can be analyzed to provide an objective view as to how urban planning can be implemented most effectively.
The effort required to generate a report to support this hypothesis, however, is enormous, complex, time-consuming and costly.
However, it can be noted that the report includes only a few sets of data points, and does not include other data that may influence whether or not simple densities of residential districts and employment districts is sufficient to support subway lines.
Further, such a report is not readily comparable with how other urban regions handle transport from residential districts to employment districts, to provide an objective assessment as to which urban region is best handling its transportation needs.
More complex questions as to how a particular urban region functions in relation to another will occur to those of skill in the art, and the generation of reports to answer such questions will face similar hurdles and complexities.
In general, such maps are very useful for navigating the urban region, but provide limited information when attempting to generate complex reports for urban planning.
The application requires the use of digital orthophotos which are costly to acquire at the resolution that is necessary to build the city model.
Further, Baltsavias does not explain how to derive building use or type and its relation to other buildings in its immediate proximity or at the city-wide scale.
The application does not allow a user to assess how a region functions or compares to other urban regions.
In general, Baltsavias is limited in how it offers to describe and visualize an urban region's composition and functions.
The technology and techniques used in Barnsley to extract building objects semi-automatically and to identify differences in morphological properties of buildings and the structural composition of built form patterns were successful in differentiating general land use types, (e.g. residential versus industrial), but there were problems in identifying and characterizing unique patterns within these general land use types, different residential and industrial patterns were not able to be characterized given the measurement techniques used.
In general, Barnsley does not teach how to classify and describe the unique built form for different residential and industrial uses.
Despite the groundwork that has been laid, there is no indication of success or how such success will be achieved.
The remote sensed imagery for Cities Revealed is quite costly to acquire for a large urban region.
The data used for the pattern recognition is unique to the UK but not available for all regions, since the UK can rely so heavily on the UK Ordnance Survey.
Likewise the spatial indices are not fully successful on other urban land use classes such as commercial and industrial where information on building characteristics would be more useful than just the arrangement of buildings.

Method used


Image

  • System, Apparatus and Method for Mapping
  • System, Apparatus and Method for Mapping
  • System, Apparatus and Method for Mapping

Examples


Embodiment Construction

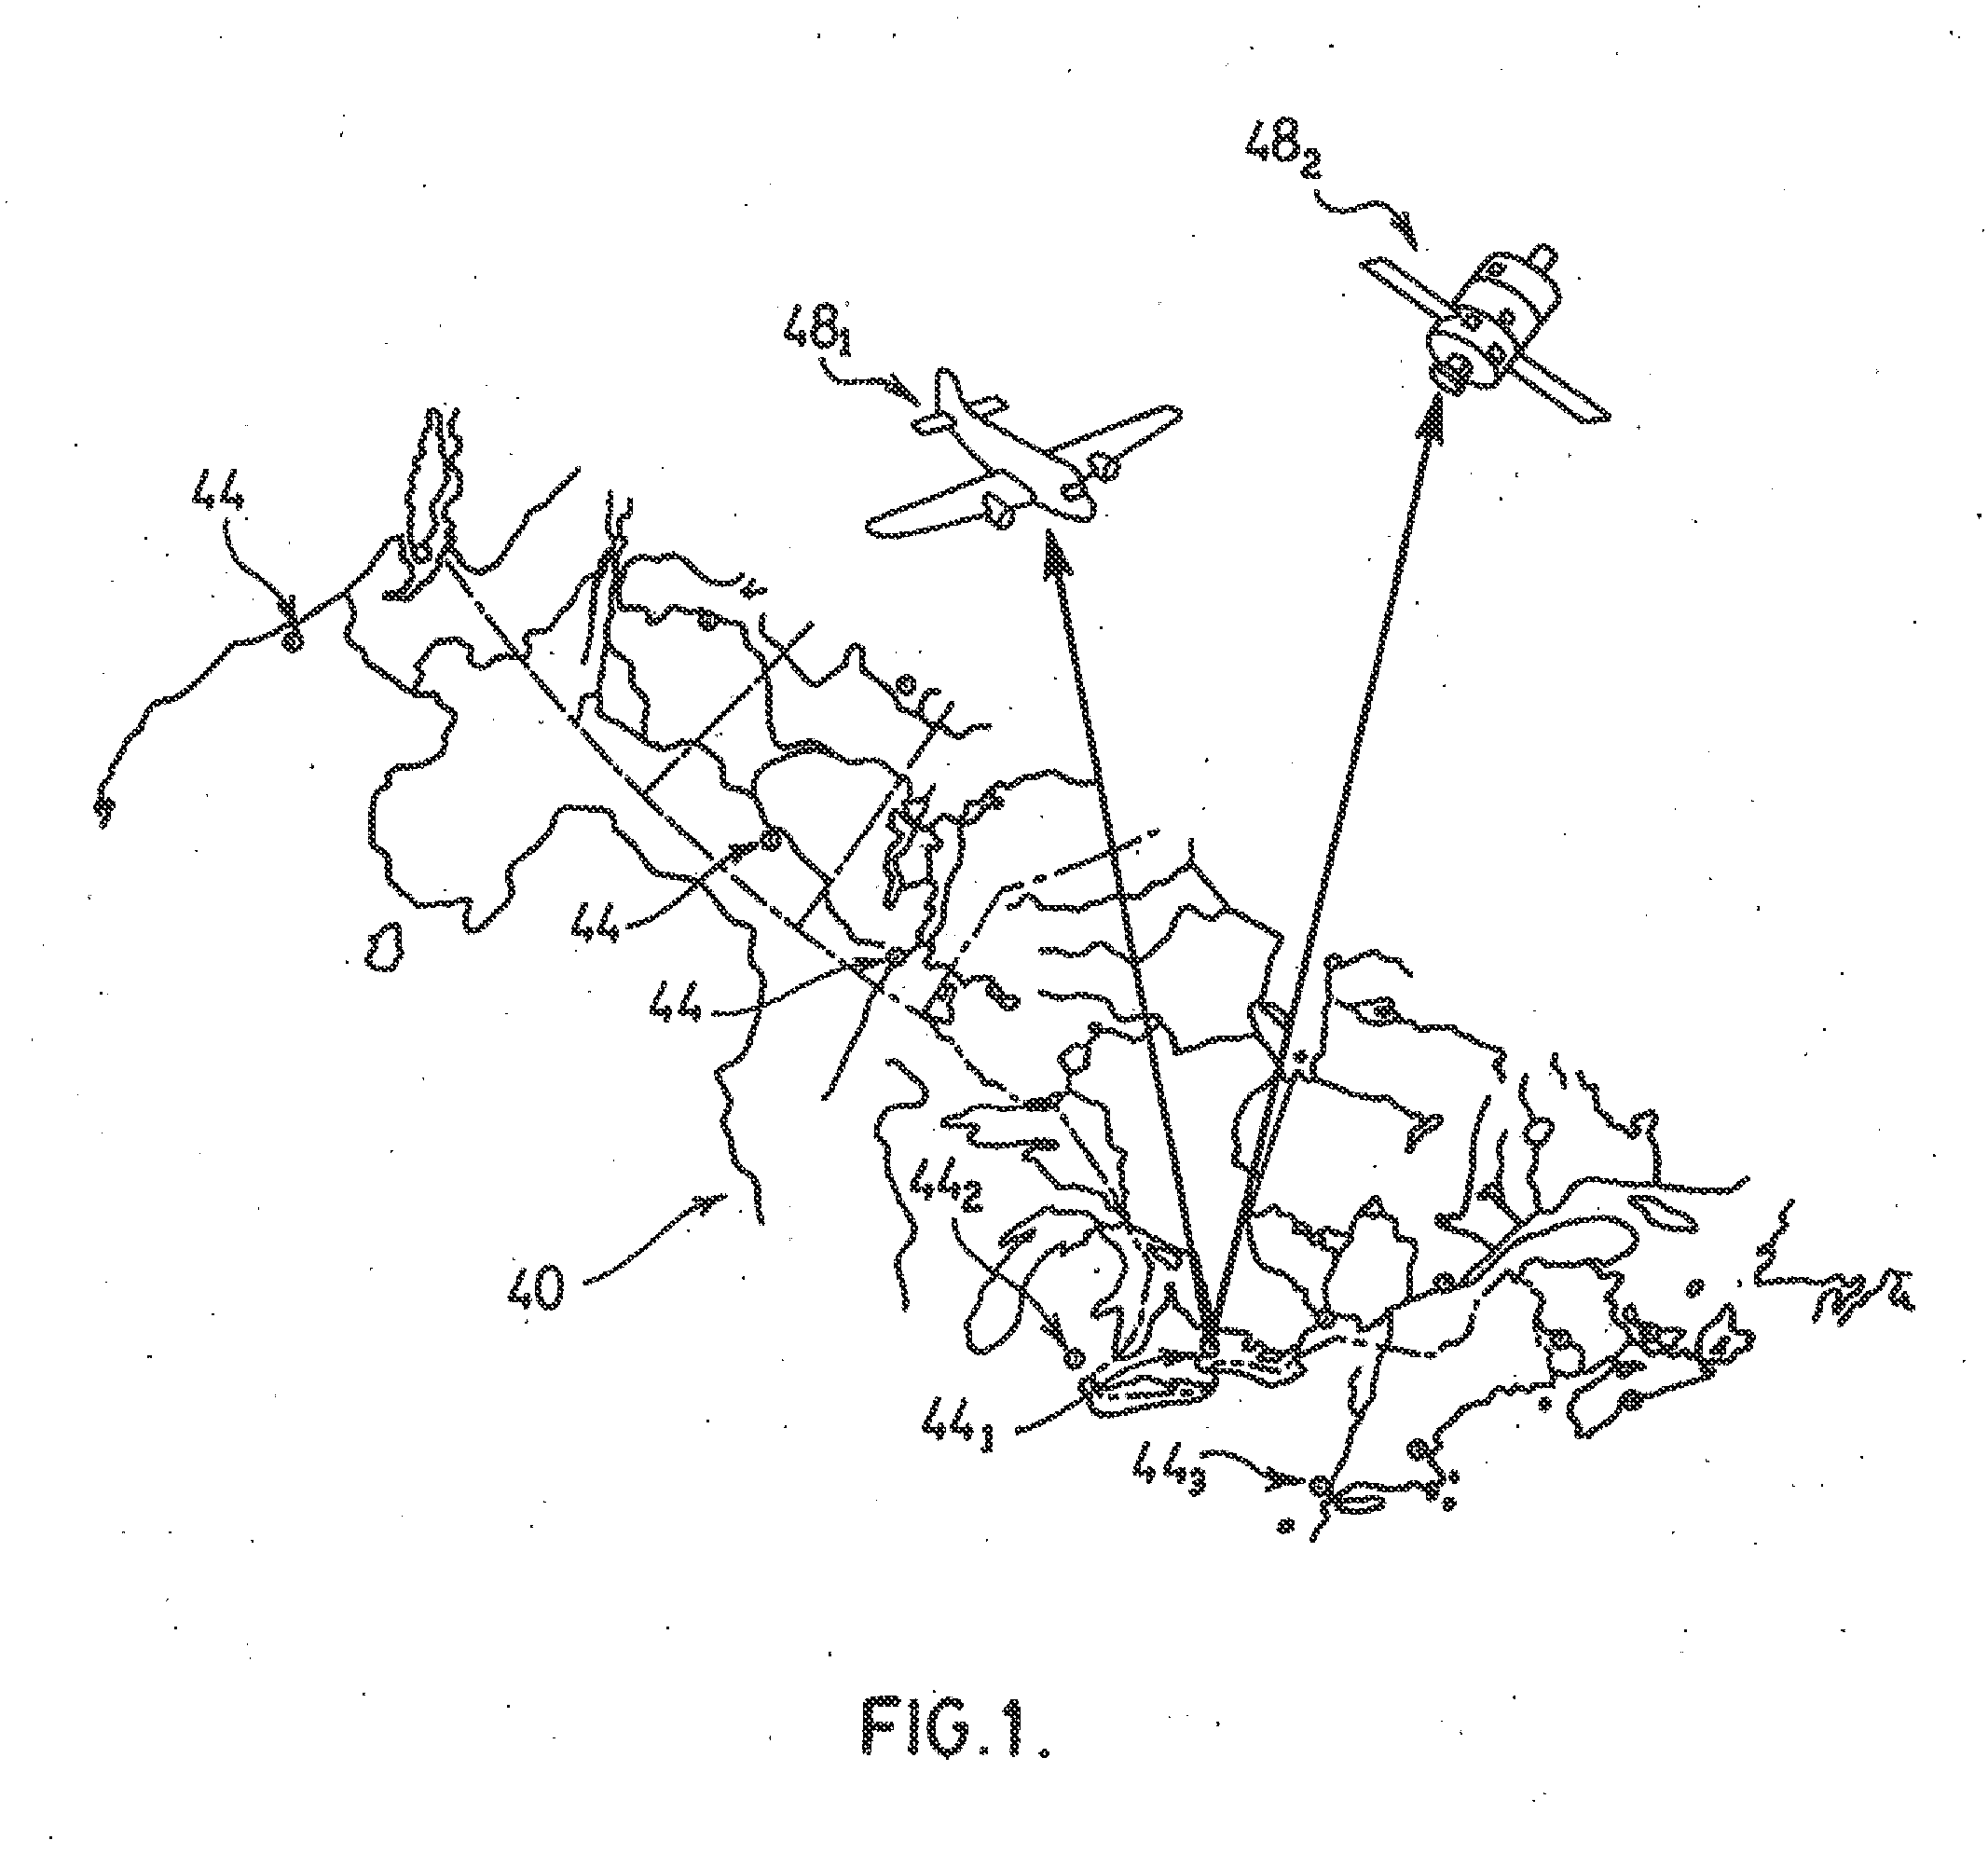
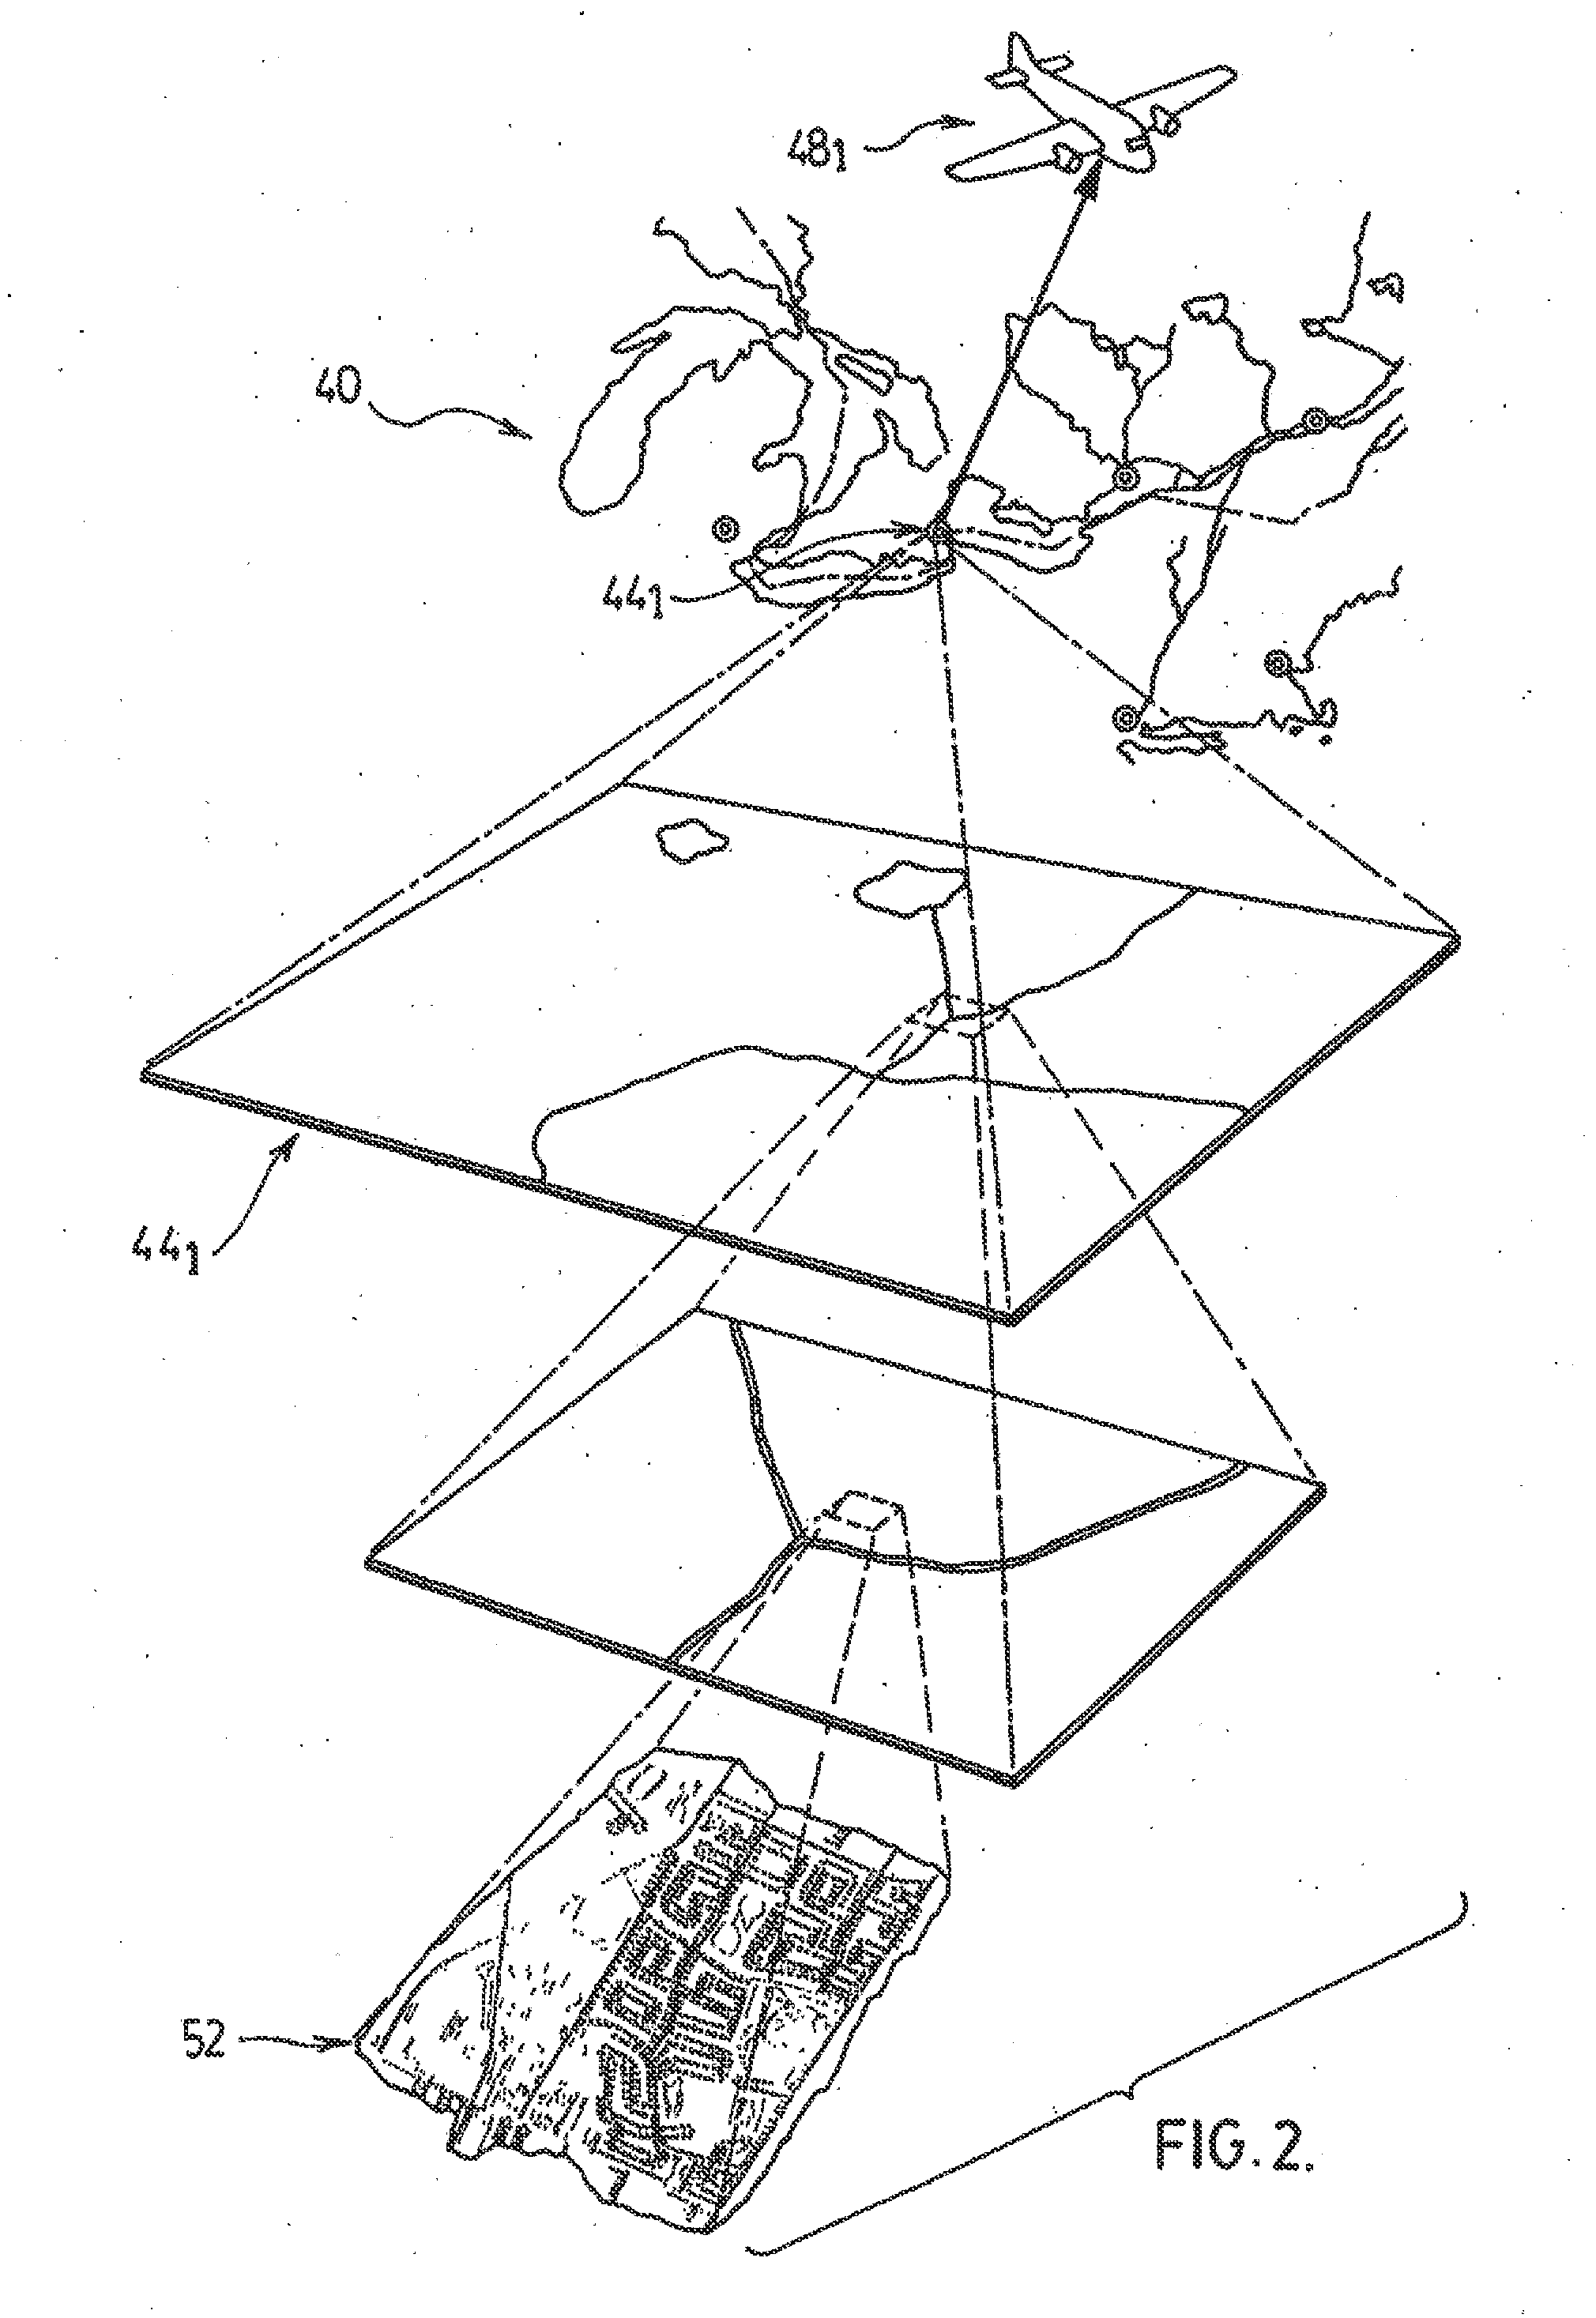
FIG. 1 shows a territory 40 containing a plurality of urban regions 44. In the example in FIG. 1, territory 40 is a section of North America roughly bisected by the US-Canada border, but it is to be understood that this is merely an example of a territory to which the teachings herein can apply. Thus, the urban regions 44 in territory 40 include various well-known urban regions, including Toronto, indicated at 441, Detroit indicated at 442, and New York at 443—other areas are simply indicated by the reference 44. It should be understood that, in a present embodiment, area 44 is not intended in its political sense, but rather to indicate urban regions in a geographic sense. Thus, an area like Toronto 441 refers to the Greater Toronto Area, or the entire “Golden Horseshoe”, spanning the municipalities from Hamilton to Bowmanville along the north shore of Lake Ontario. In like fashion, Detroit 442, and New York 443 refer to their respective greater metropolitan areas.

FIG. 1 also shows ...


PUM


Abstract

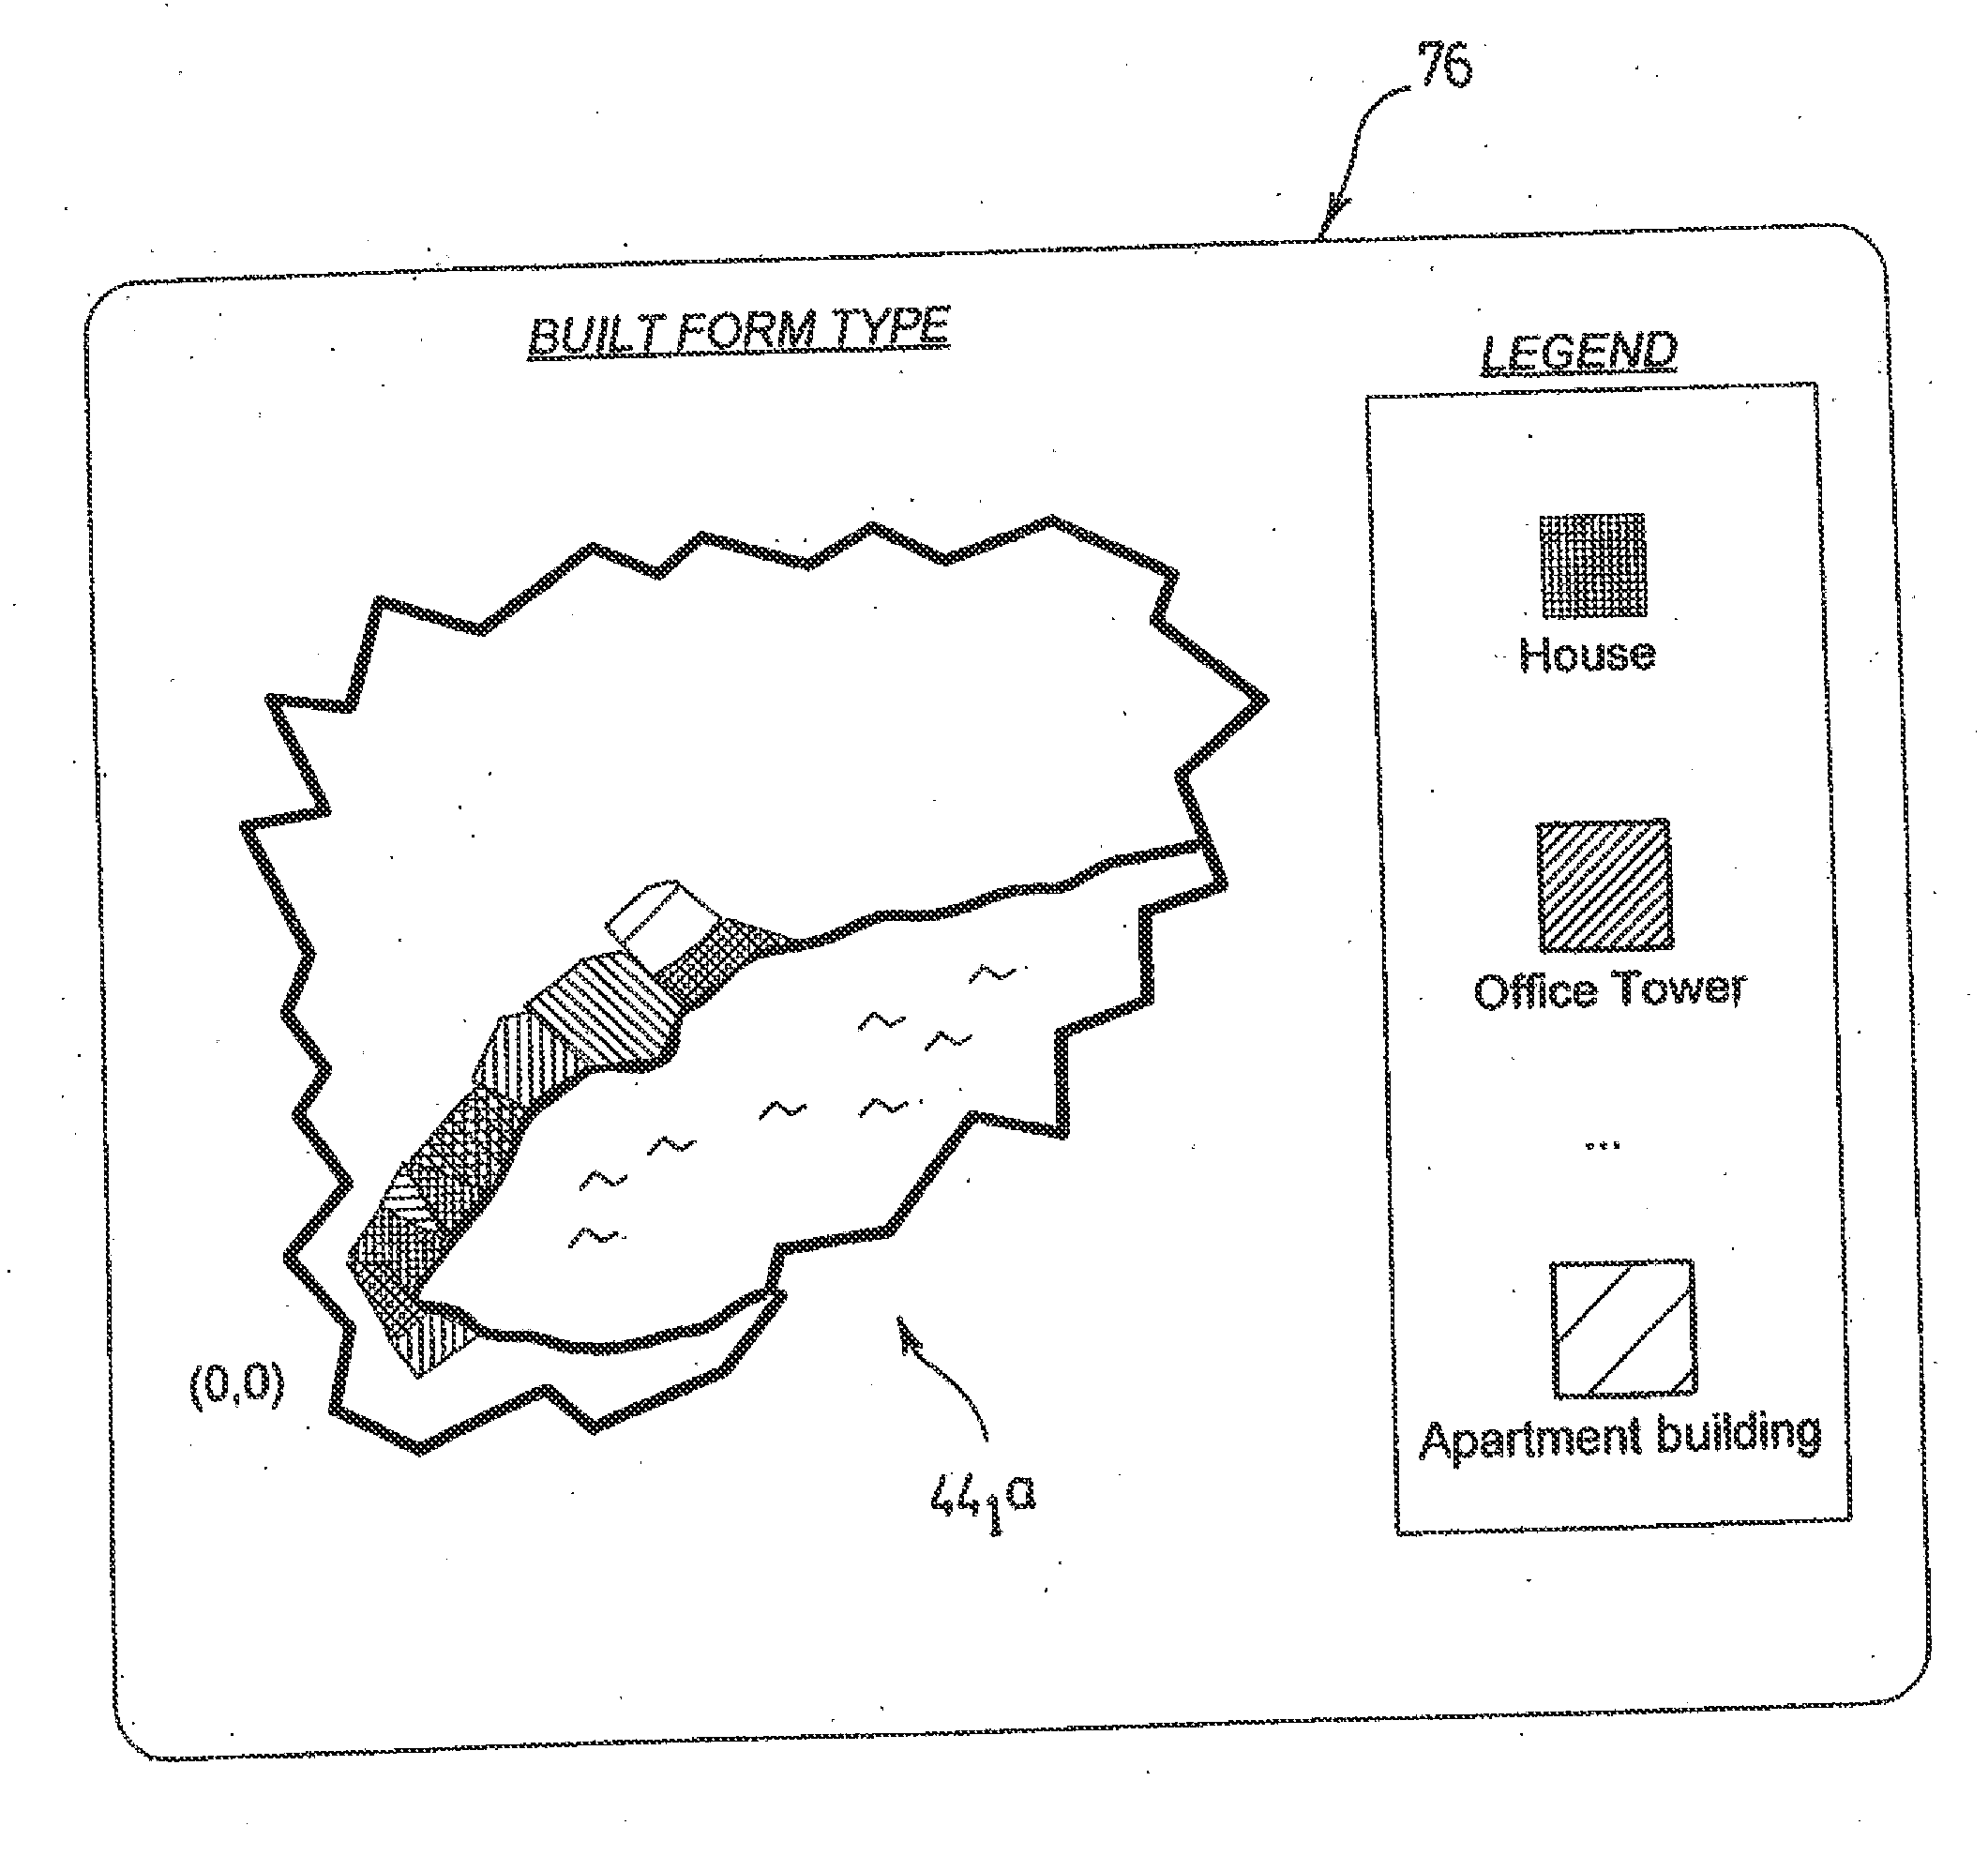
The present invention provides a novel apparatus and method for mapping of urban regions. An apparatus includes the remote sensing equipment that is connected to a computer processor. The remote sensing equipment gathers imaging data about an urban region. The computer processor interprets the imaging data to generate a map of the urban region comprising representations that identify a first set of indicia representing physiographic characteristics, a second set of indicia representing different types of built forms, and a third set of indicia representing patterns of human activity associated with both the physiographic characteristics and the built forms. The map can also include a fourth set of indicia representing an intensity level that at least one of the other types of indicia occurs.

Description

FIELD OF THE INVENTIONThe present invention relates generally to cartography and more particularly relates to mapping of urban regions.BACKGROUND OF THE INVENTIONThe twentieth century, particularly, saw the exponential growth of urban regions throughout the world, and in its latter half, the quantum development of suburban districts around the peripheries of cities, fuelled by expressways and the dominance of the automobile-based society. This condition, in which the majority of North Americans, for example, now live in suburbs with low rates of built density and human activity, is generally unable economically to sustain mass transportation. Residence, work, shopping and leisure are not only low in density, and highly land consuming, but activities are generally segregated and separate. In consequence, there is now widespread concern for the effects of such dependence on the automobile—in air pollution, greatly increasing delays, in the increasing aggregate traveling that decreases...

Claims


Application Information

Patent Timeline
Patent Type & Authority Applications(United States)
IPC IPC(8): G06T15/60G06T11/00G09B29/00G09B29/10
CPCG09B29/10G09B29/106G06T11/20G06K9/00476G01C21/32G01C21/3852G06V30/422
Inventor COOMBES, ANTHONY C.BURCHFIELD, MARCY L.GEILE, WOLFHARD
Owner 1626628 ONTARIO LTD
Learn More