
Player streaks and game data visualization

a game data and player technology, applied in the field of player streaks and game data visualization, can solve the problems of difficult to determine if a player is consistently doing well, difficult to see what is important, and probably have difficulty focusing on what is importan

Active Publication Date: 2008-06-26
YAHOO ASSETS LLC
View PDF44 Cites 27 Cited by
  • Summary
  • Abstract
  • Description
  • Claims
  • Application Information

AI Technical Summary

Benefits of technology

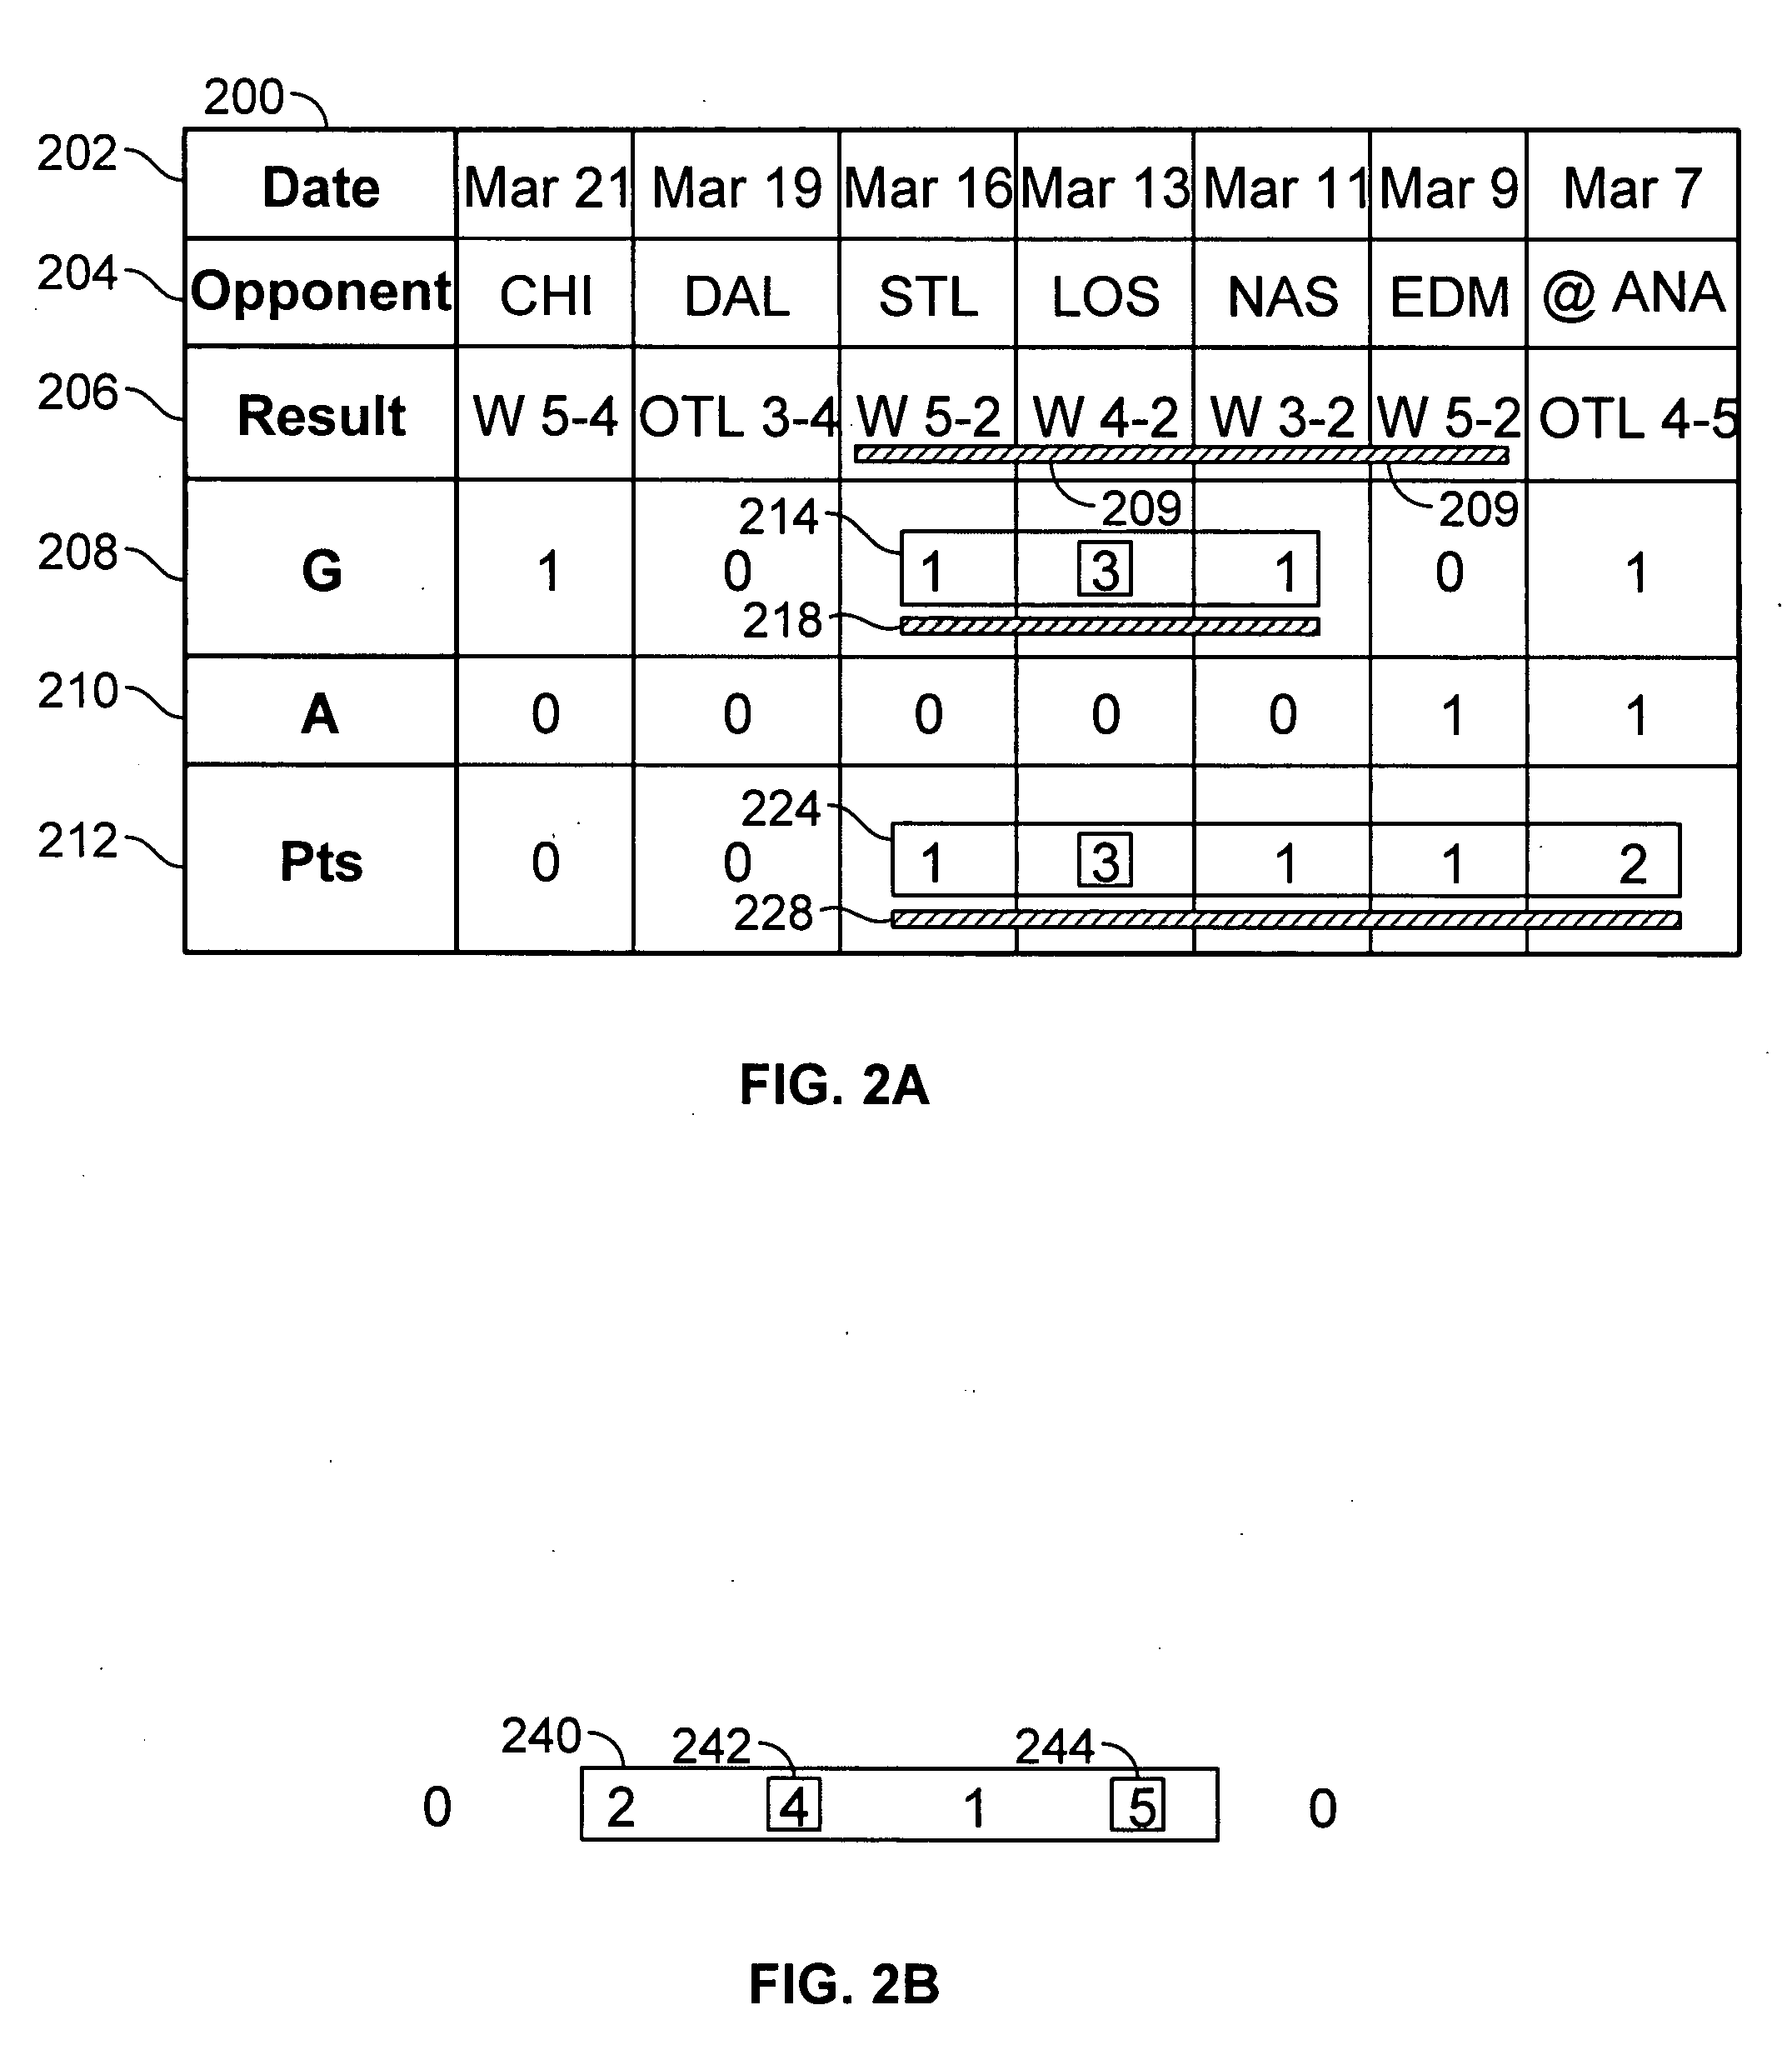
[0004]In a first aspect, the invention features a computer-enabled method of displaying a statistical streak in a set of displayed data values to visually indicate achievement of a performance objective in at least two consecutive sports events in which a sports entity participates. The method includes the step of displaying an indicator that extends from a first position associated with a first data value to a second position associated with a second data value, where the first data value and the second data value meet a predetermined value for a particular statistical measure in two consecutive sports events. Embodiments of the invention may include one or more of the following features. The first data value and the second data value may meet the predetermined value if the first data value and the second data value are greater than the predetermined value. The first data value and the second data value may meet the predetermined value if the first data value and the second data value are equal to the predetermined value. The indicator may include a line segment extending from adjacent the first data value to adjacent the second data value. The set of displayed data values may be displayed in a table having columns and rows, where displaying an indicator includes the step of displaying a line segment adjacent to the column, where the line segment extends from adjacent the first data value to adjacent the second data value. The set of displayed data values may include data in a table having columns and rows, wherein displaying an indicator includes the step of displaying a line segment adjacent to the row, where the line segment extends from adjacent the first data value to adjacent the second data value. The step of displaying an indicator may include varying the visual appearance of the first data value and the second data value to distinguish the first data value and the second data value from other data values. The step of displaying an indicator may include varying the background color of the first data value and of the second data value to distinguish the first data value and the second data value from other data values. The method may include the step of displaying a description of the streak, where the description is visually associated with the indicator, and the description comprises the streak's length in time periods and a ranking of the streak's length relative to other streaks. The method may include the step of displaying the description of the streak in response to user selection of the first data value, the second data value, the indicator, or a combination thereof. The method may include the step of highlighting at least one data value, where the at least one data value represents the sports entity's performance according to a particular statistical measure in a sports event, and the at least one data value meets the predetermined value. Highlighting may...

Problems solved by technology

While the information a user is looking for may be present in the displayed data, it is often difficult to determine if a player is consistently doing well, or has achieved something statistically special in a given game.
Because of the quantity of numerical information displayed, it is difficult to see what is important and when the player did well over a series of games.
A user looking at the table shown in FIG. 3 will probably have difficulty focusing on what is important; because nothing visually stands out in the table of data.

Method used


Image

  • Player streaks and game data visualization
  • Player streaks and game data visualization
  • Player streaks and game data visualization

Examples


Embodiment Construction

[0016]The following description is presented to enable any person skilled in the art to make and use the invention, and is provided in the context of particular applications and their requirements. Various modifications to the preferred embodiments will be readily apparent to those skilled in the art, and the generic principles defined herein may be applied to other embodiments and applications without departing from the spirit and scope of the invention. Moreover, in the following description, numerous details are set forth for the purpose of explanation. However, one of ordinary skill in the art will realize that the invention might be practiced without the use of these specific details. In other instances, well-known structures and devices are shown in block diagram form in order not to obscure the description of the invention with unnecessary detail. Thus, the present invention is not intended to be limited to the embodiments shown, but is to be accorded the widest scope consist...


PUM


Abstract

A computer based method visually highlights achievements of sports teams or players in displays of statistical data, such as statistical tables, that represent the performance of sports teams or players. The achievements to be highlighted may include multiple-game streaks and single-game achievements. Multiple-game streaks occur when a team or player meets a performance objective in multiple consecutive games. Such streaks are highlighted in displays of statistical data by visually emphasizing the data values that form the streak. Visual emphasis is achieved by, for example, displaying a visual indicator, such as a line, adjacent to the data values. A single-game achievement is highlighted by visually emphasizing the data value that represents the achievement, so that users can quickly identify single-game achievements in statistical tables. Details about the streak or achievement may be displayed when the user selects or passes a mouse pointer over one of the data values or over the visual indicator.

Description

BACKGROUND OF THE INVENTION[0001]In the world of sports, many statistics are generated for each players in each game, and many games are played in a season. Yahoo!® Sports and other information sources typically display this statistical data and present it to the user as a listing or table of data values. Users may read this statistical data for a variety of reasons, e.g., to analyze the past performance of a sports team or player for the purpose of improving the future performance of a fantasy sports team. While the information a user is looking for may be present in the displayed data, it is often difficult to determine if a player is consistently doing well, or has achieved something statistically special in a given game.[0002]For example, FIG. 3 shows a listing of a National Hockey League (NHL) player's game statistics for the month of March. Because of the quantity of numerical information displayed, it is difficult to see what is important and when the player did well over a s...

Claims


Application Information

Patent Timeline
IPC IPC(8): G06F3/048G06F17/00G06F3/00
CPCG06Q10/10
Inventor HIRANO, KELLYBOGS, ERICWARE, SCOTT B.
Owner YAHOO ASSETS LLC
Learn More