
Data object visualization using graphs

a data object and graph technology, applied in the field of data visualization on the computer, can solve the problems of limited dynamic content, difficult for end-users to comprehend, limited set of graphing options, etc., and achieve the effect of facilitating understanding of facts

Inactive Publication Date: 2007-08-09
GOOGLE LLC
View PDF35 Cites 29 Cited by
  • Summary
  • Abstract
  • Description
  • Claims
  • Application Information

AI Technical Summary

Benefits of technology

[0014] The above need is met by a system, method, and computer program product for graphically presenting facts. In one embodiment, a set of facts is established, where each fact has an attribute and a corresponding value. A graph type that facilitates understanding of the facts are determined, and the facts are displayed in a graph of the determined type.

Problems solved by technology

Information on the web is not always in a format that is easy for the end-user to comprehend.
Some web sites, like sites providing stock prices and other financial information, provide limited amounts of dynamic content.
Even on these sites, however, the person is restricted to a limited set of graphing options.
Further, there is no way for a person to graphically manipulate data contained on multiple web sites short of copying the desired information into separate graphing program.

Method used


Image

  • Data object visualization using graphs
  • Data object visualization using graphs
  • Data object visualization using graphs

Examples


Embodiment Construction

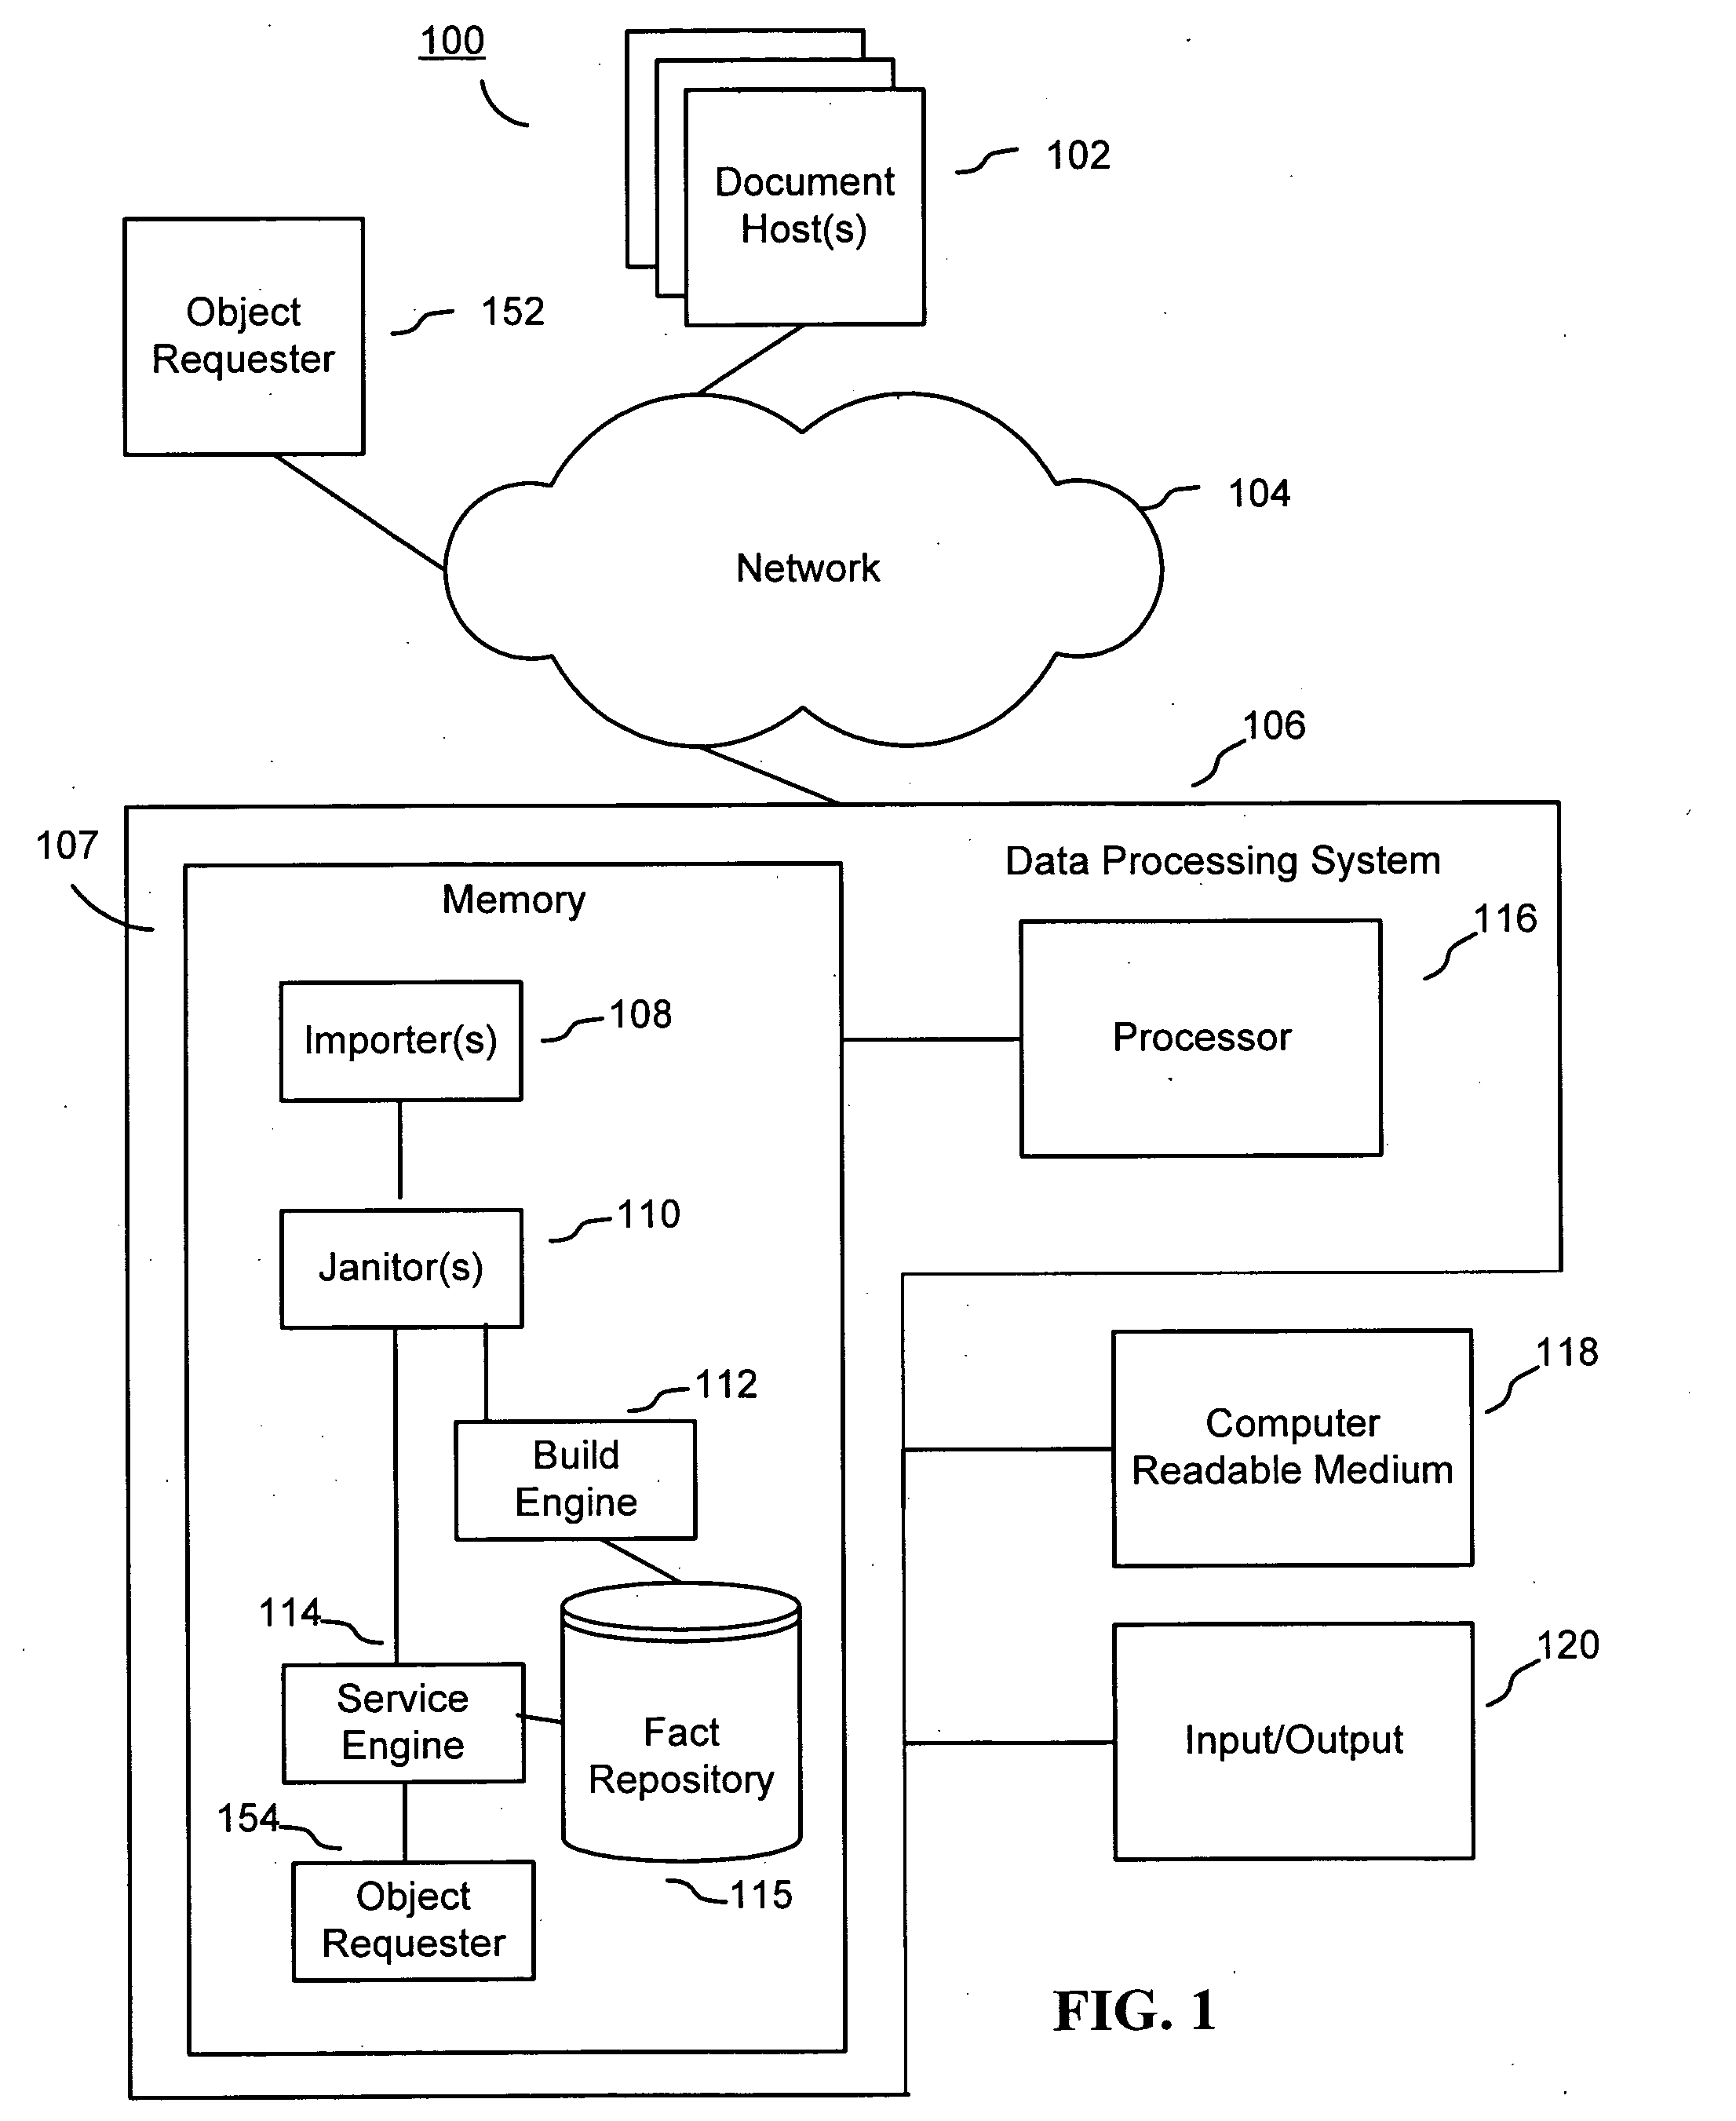
[0026]FIG. 1 shows a system architecture 100 adapted to support one embodiment of the invention. FIG. 1 shows components used to add facts into, and retrieve facts from a repository 115. The system architecture 100 includes a network 104, through which any number of document hosts 102 communicate with a data processing system 106, along with any number of object requesters 152, 154.

[0027] Document hosts 102 store documents and provide access to documents. A document is comprised of any machine-readable data including any combination of text, graphics, multimedia content, etc. A document may be encoded in a markup language, such as Hypertext Markup Language (HTML), i.e., a web page, in a interpreted language (e.g., JavaScript) or in any other computer readable or executable format. A document can include one or more hyperlinks to other documents. A typical document will include one or more facts within its content. A document stored in a document host 102 may be located and / or ident...


PUM


Abstract

A presentation engine presents facts in a UI having a graph. Through manipulation of the UI, an end-user can add or remove facts from the graph, and can sort the facts shown in the graph based on values that are shown, or not shown, in the graph. The presentation engine determines a graph type that best facilitates interpretation of the facts by the end-user and automatically creates a graph of that type. Possible graph types include bar graphs, scatter plots, timelines, and maps.

Description

CROSS-REFERENCE TO RELATED APPLICATIONS [0001] This application is related to the following U.S. Applications, all of which are incorporated by reference herein: [0002] U.S. application Ser. No. ______, entitled “Data Object Visualization”, filed concurrently herewith, by Andrew W. Hogue, David Vespe, Alex Kehlenbeck, Mike Gordon, Jeffrey C. Reynar, David Alpert, Attorney Docket No. 24207-10946; [0003] U.S. application Ser. No. ______, entitled “Data Object Visualization Using Maps”, filed concurrently herewith, by Andrew W. Hogue, David Vespe, Alex Kehlenbeck, Mike Gordon, Jeffrey C. Reynar, David Alpert, Attorney Docket No. 24207-10947; [0004] U.S. application Ser. No. ______, entitled “Object Categorization for Information Extraction”, filed concurrently herewith, by Jonathan T. Betz, Attorney Docket No. 24207-10952; [0005] U.S. application Ser. No. ______, entitled “Designating Data Objects for Analysis”, filed concurrently herewith, by Andrew W. Hogue, David Vespe, Alex Kehlenb...

Claims


Application Information

Patent Timeline
Patent Type & Authority Applications(United States)
IPC IPC(8): G06F7/00
CPCG06F17/30905G06F17/30675G06T11/206G06F16/248G06F16/9577Y10S707/919G06F16/334G06F40/103
Inventor HOGUE, ANDREW W.VESPE, DAVID J.KEHLENBECK, ALEXANDERGORDON, MICHAELREYNAR, JEFFREY C.ALPERT, DAVID B.
Owner GOOGLE LLC
Learn More