
System and method for providing a dynamic user interface for a dense three-dimensional scene

a dynamic user interface and dense three-dimensional scene technology, applied in the field of user interfaces, can solve problems such as data misinterpretation, difficult to understand and navigate the screen of densely-packed clusters, and complicate the perception of visualized data

Active Publication Date: 2007-05-17
NUIX NORTH AMERICA
View PDF23 Cites 53 Cited by
  • Summary
  • Abstract
  • Description
  • Claims
  • Application Information

AI Technical Summary

Benefits of technology

[0007] An embodiment provides a system and method for providing a user interface for a dense three-dimensional scene. Clusters are placed in a three-dimensional scene arranged proximal to each other such cluster to form a cluster spine. Each cluster includes one or more concepts. Each cluster spine is projected into a two-dimensional display relative to a stationary perspective. Controls operating on a view of the cluster spines in the displ

Problems solved by technology

However, forcibly mapping the display of the clusters into a three-dimensional scene or a two-dimensional screen can cause data misinterpretation.
As well, a screen of densely-packed clusters can be difficult to understand and navigate, particularly where annotated text labels overlie clusters directly.
Other factors can further complicate visualized data perception, such as described in R. E. Horn, “Visual Language: Global Communication for the 21st Century,” Ch.
Careful use of color, shape and temporal attributes can simulate multiple dimensions, but comprehension and usability become increasingly difficult as additional layers are artificially grafted into the two-dimensional space and screen density increases.
In addition, large sets of data, such as email stores, document archives and databases, can be content rich and can yield large sets of clusters that result in a complex graphical representation.
Physical display space, however, is limited and large cluster sets can appear crowded and dense, thereby hindering understandability.
Moreover, complex graphical data can be difficult to comprehend when displayed without textual references to underlying content.
The user is forced to mentally note “landmark” clusters and other visual cues, which can be particularly difficult with large cluster sets.
However, annotating text directly into a graphical display can be cumbersome, particularly where the clusters are densely packed and cluster labels overlay or occlude the screen display.
A more subtle problem occurs when the screen is displaying a two-dimensional projection of three-dimensional data and the text is annotated within the two-dimensional space.
Also, reorienting the display can visually shuffle the displayed clusters and cause a loss of user orientation.
Furthermore, navigation can be non-intuitive and cumbersome, as cluster placement is driven by available display space and the labels may overlay or intersect placed clusters.

Method used


Image

  • System and method for providing a dynamic user interface for a dense three-dimensional scene
  • System and method for providing a dynamic user interface for a dense three-dimensional scene
  • System and method for providing a dynamic user interface for a dense three-dimensional scene

Examples


example multiple

Compasses

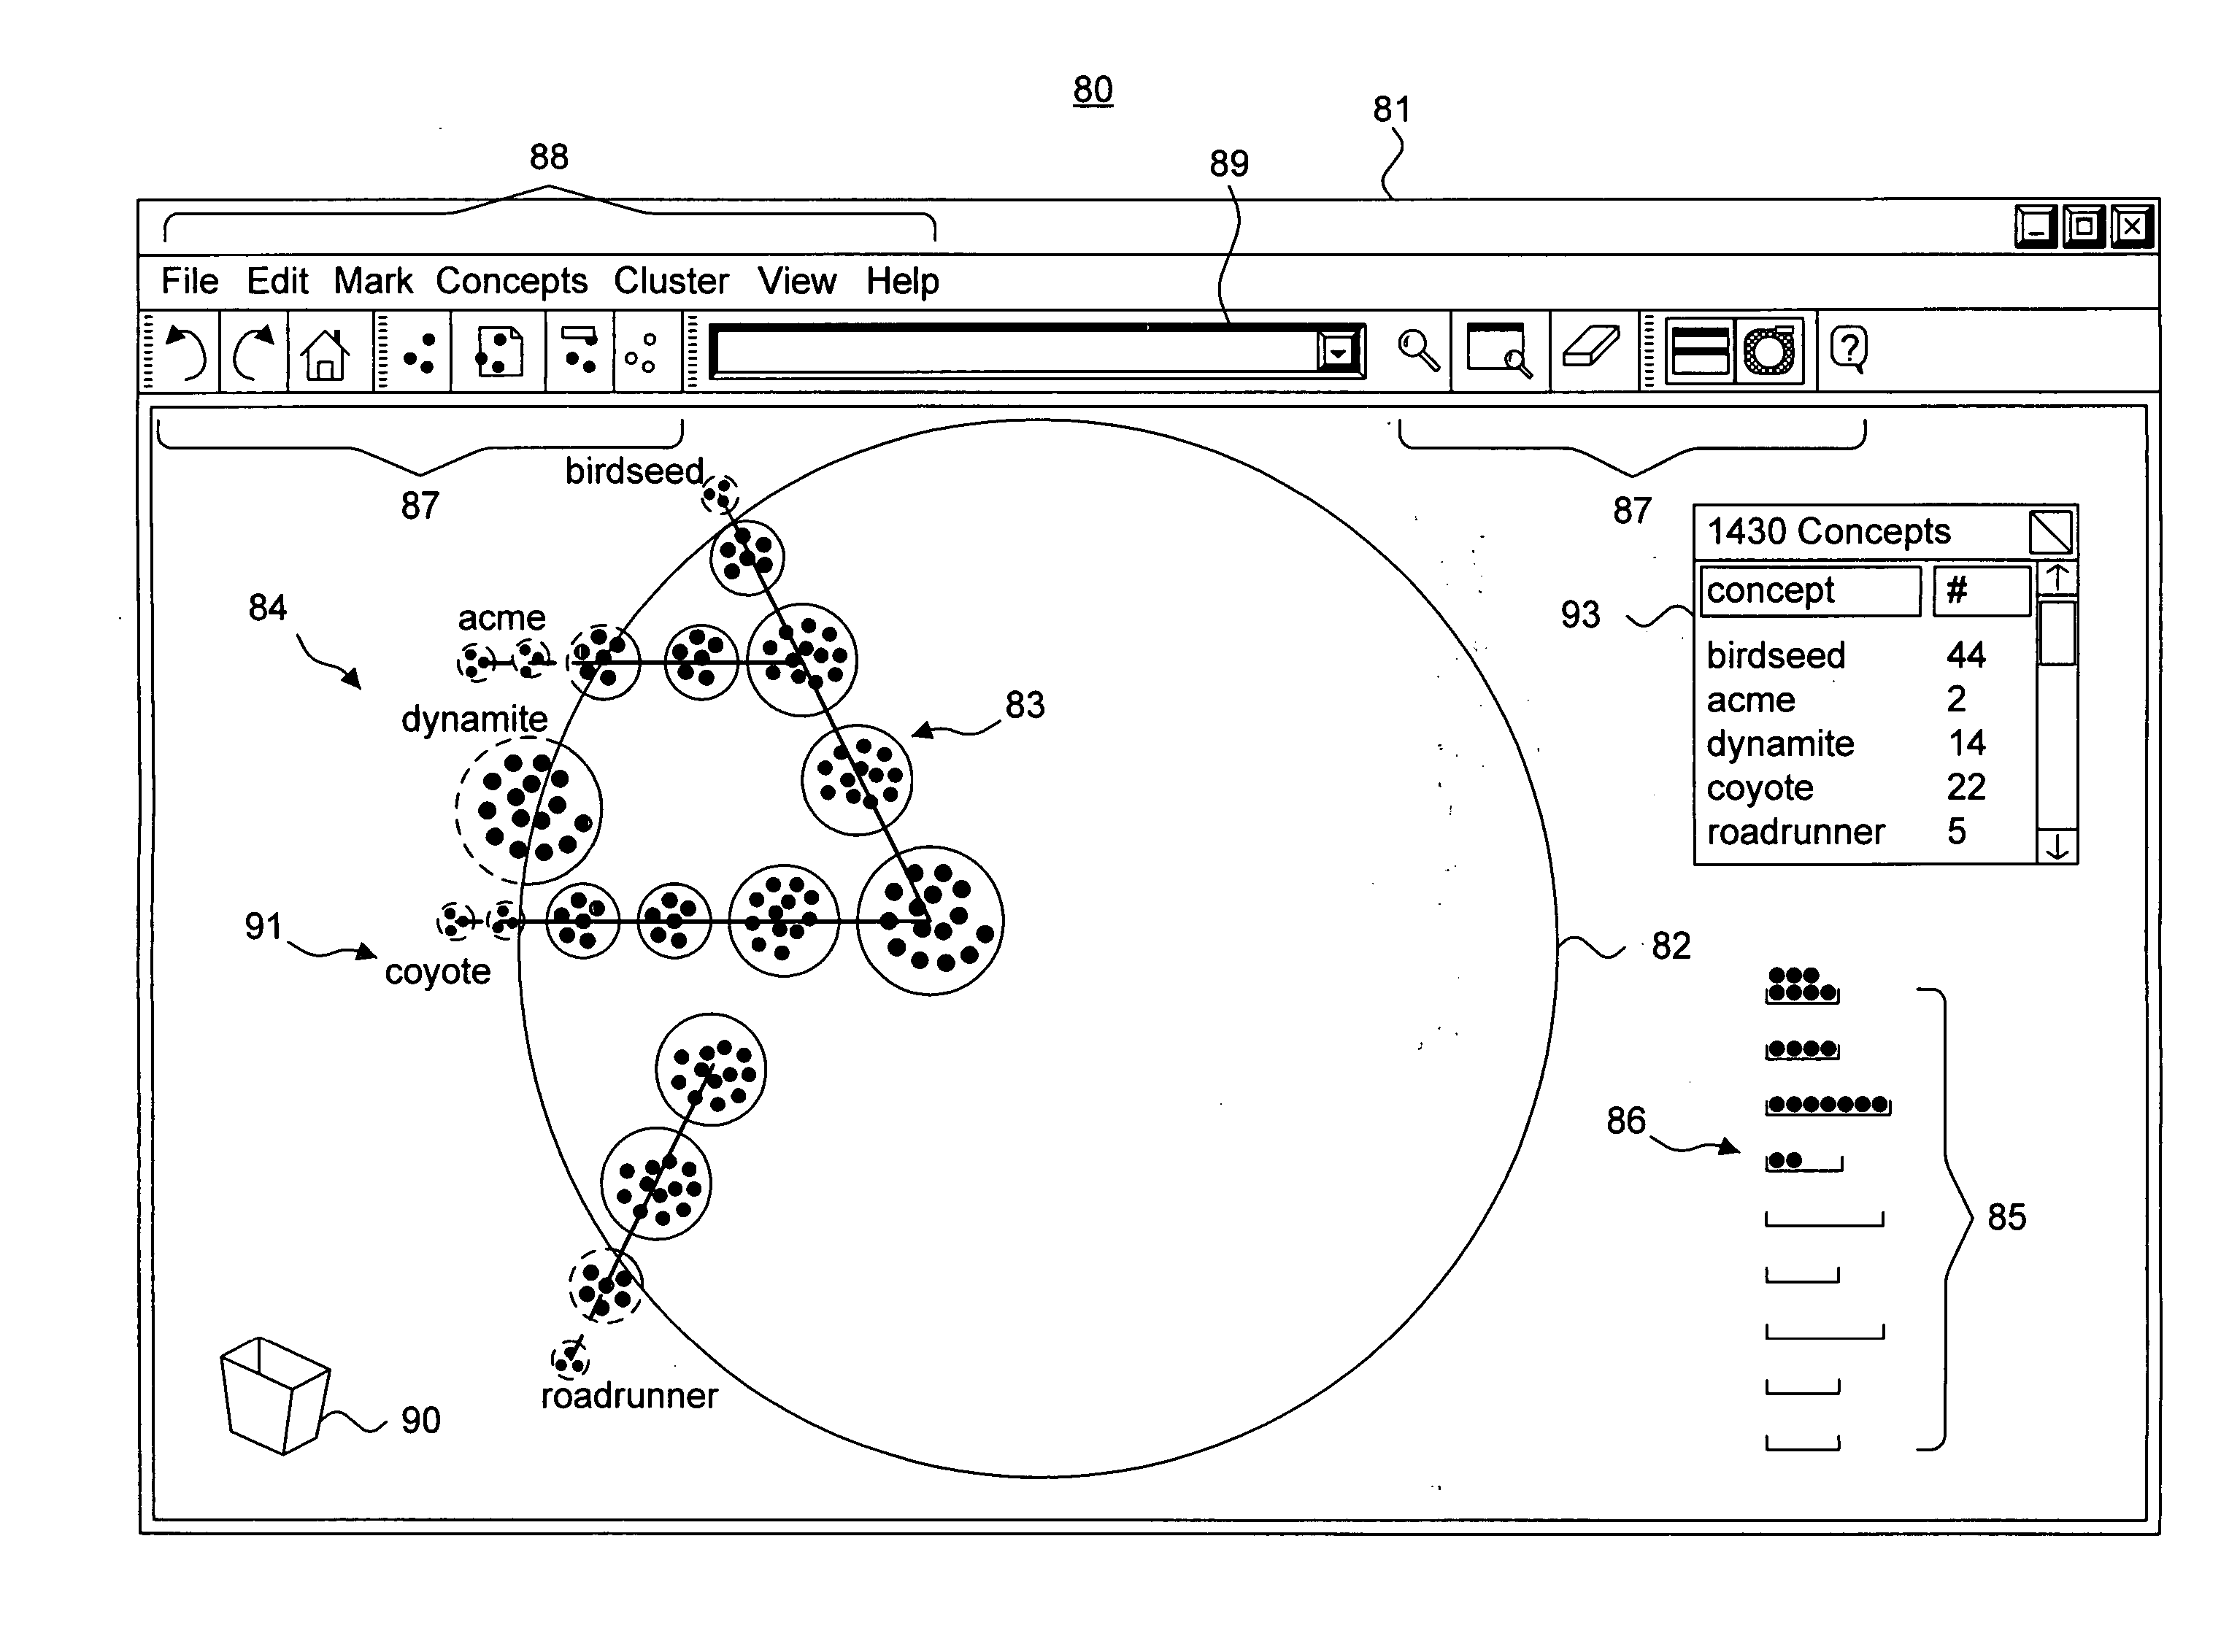
[0080]FIG. 7 is a data representation diagram 160 showing, by way of example, multiple compasses 161, 162 generated using the user interface 81 of FIGS. 4A-C. Each compass 161, 162 operates independently from any other compass and multiple compasses can 161, 162 be placed in disjunctive, overlapping or concentric configurations to allow the user to emphasize different aspects of the placed cluster spines 124 without panning or zooming. Spine labels for placed cluster spines are generated based on the respective focus of each compass 161, 162. Thus, the placed cluster spines 166 appearing within the focused area of an inner compass 162 situated concentric to an outer compass 161 result in one set of spine labels, while those placed cluster spines 165 appearing within the focused area of the outer compass 161 result in another set of spine labels, which may be different that the inner compass spine labels set. In addition, each compass 161, 162 can be independently resized. O...

example single

and Multiple Compasses

[0081] FIGS. 8A-C are data representation diagrams 170, 180, 190 showing, by way of example, single 171 and multiple compasses 171, 181 generated using the user interface of FIGS. 4A-C. Multiple compasses can be used to show concepts through spine labels concerning those cluster spines appearing within their focus, whereas spine labels for those same concepts may not be otherwise generated. Referring first to FIG. 8A, an outer compass 171 frames four sets of cluster spines 174, 175, 176, 177. Spine labels for only three of the placed cluster spines 175, 176, 177 in the “focused” area 173 are generated and placed along the outer circumference of the outer compass 171. Referring next to FIG. 8B, an inner compass 181 frames the set of cluster spines 174. Spine labels for the placed cluster spines 174 in the “focused” area 182 are generated and placed along the outer circumference of the inner compass 181, even though these spine same labels were not generated and ...


PUM


Abstract

A system and method for providing a dynamic user interface for a dense three-dimensional scene is presented. Clusters are placed in a three-dimensional scene arranged proximal to each other such cluster to form a cluster spine. Each cluster includes one or more concepts. Each cluster spine is projected into a two-dimensional display relative to a stationary perspective as a hierarchical view of the cluster spines in the display. Folder controls operating on the hierarchical view are presented. The hierarchical view includes an indicator representing each cluster spine and a line indicating the cluster spine interrelationships relative to other cluster spines. A label is generated to identify one such concept included in each cluster spine in the hierarchical view.

Description

CROSS REFERENCE TO RELATED APPLICATION [0001] This patent application is a continuation-in-part of U.S. patent application Ser. No. 11 / 044,158, filed Jan. 26, 2005, pending, the priority date of which is claimed and the disclosure of which is incorporated by reference.FIELD OF THE INVENTION [0002] The invention relates in general to user interfaces and, in particular, to a system and method for providing a dynamic user interface for a dense three-dimensional scene. BACKGROUND OF THE INVENTION [0003] Text mining can be used to extract latent semantic content from collections of structured and unstructured text. Data visualization can be used to model the extracted semantic content, which transforms numeric or textual data into graphical data to assist users in understanding underlying semantic principles. For example, clusters group sets of concepts into a graphical element that can be mapped into a graphical screen display. When represented in multi-dimensional space, the spatial or...

Claims


Application Information

Patent Timeline
IPC IPC(8): G06T15/00
CPCG06F3/04815G06F17/30713G06F3/04817G06F16/358G06F40/166G06F3/04842G06F3/0485
Inventor BORCHARDT, JONATHAN M.WALTER, EDWARD L.
Owner NUIX NORTH AMERICA
Learn More