Methods for measuring analyte in a subject and/or compensating for incomplete reaction involving detection of the analyte
a technology of analyte and analyte detection, applied in the field of predictive kinetic methods, can solve the problems of large variable dependencies, limited linear ranges, and high dependence on nois
- Summary
- Abstract
- Description
- Claims
- Application Information
AI Technical Summary
Problems solved by technology
Method used
Image
Examples
example 1
Preliminary Studies
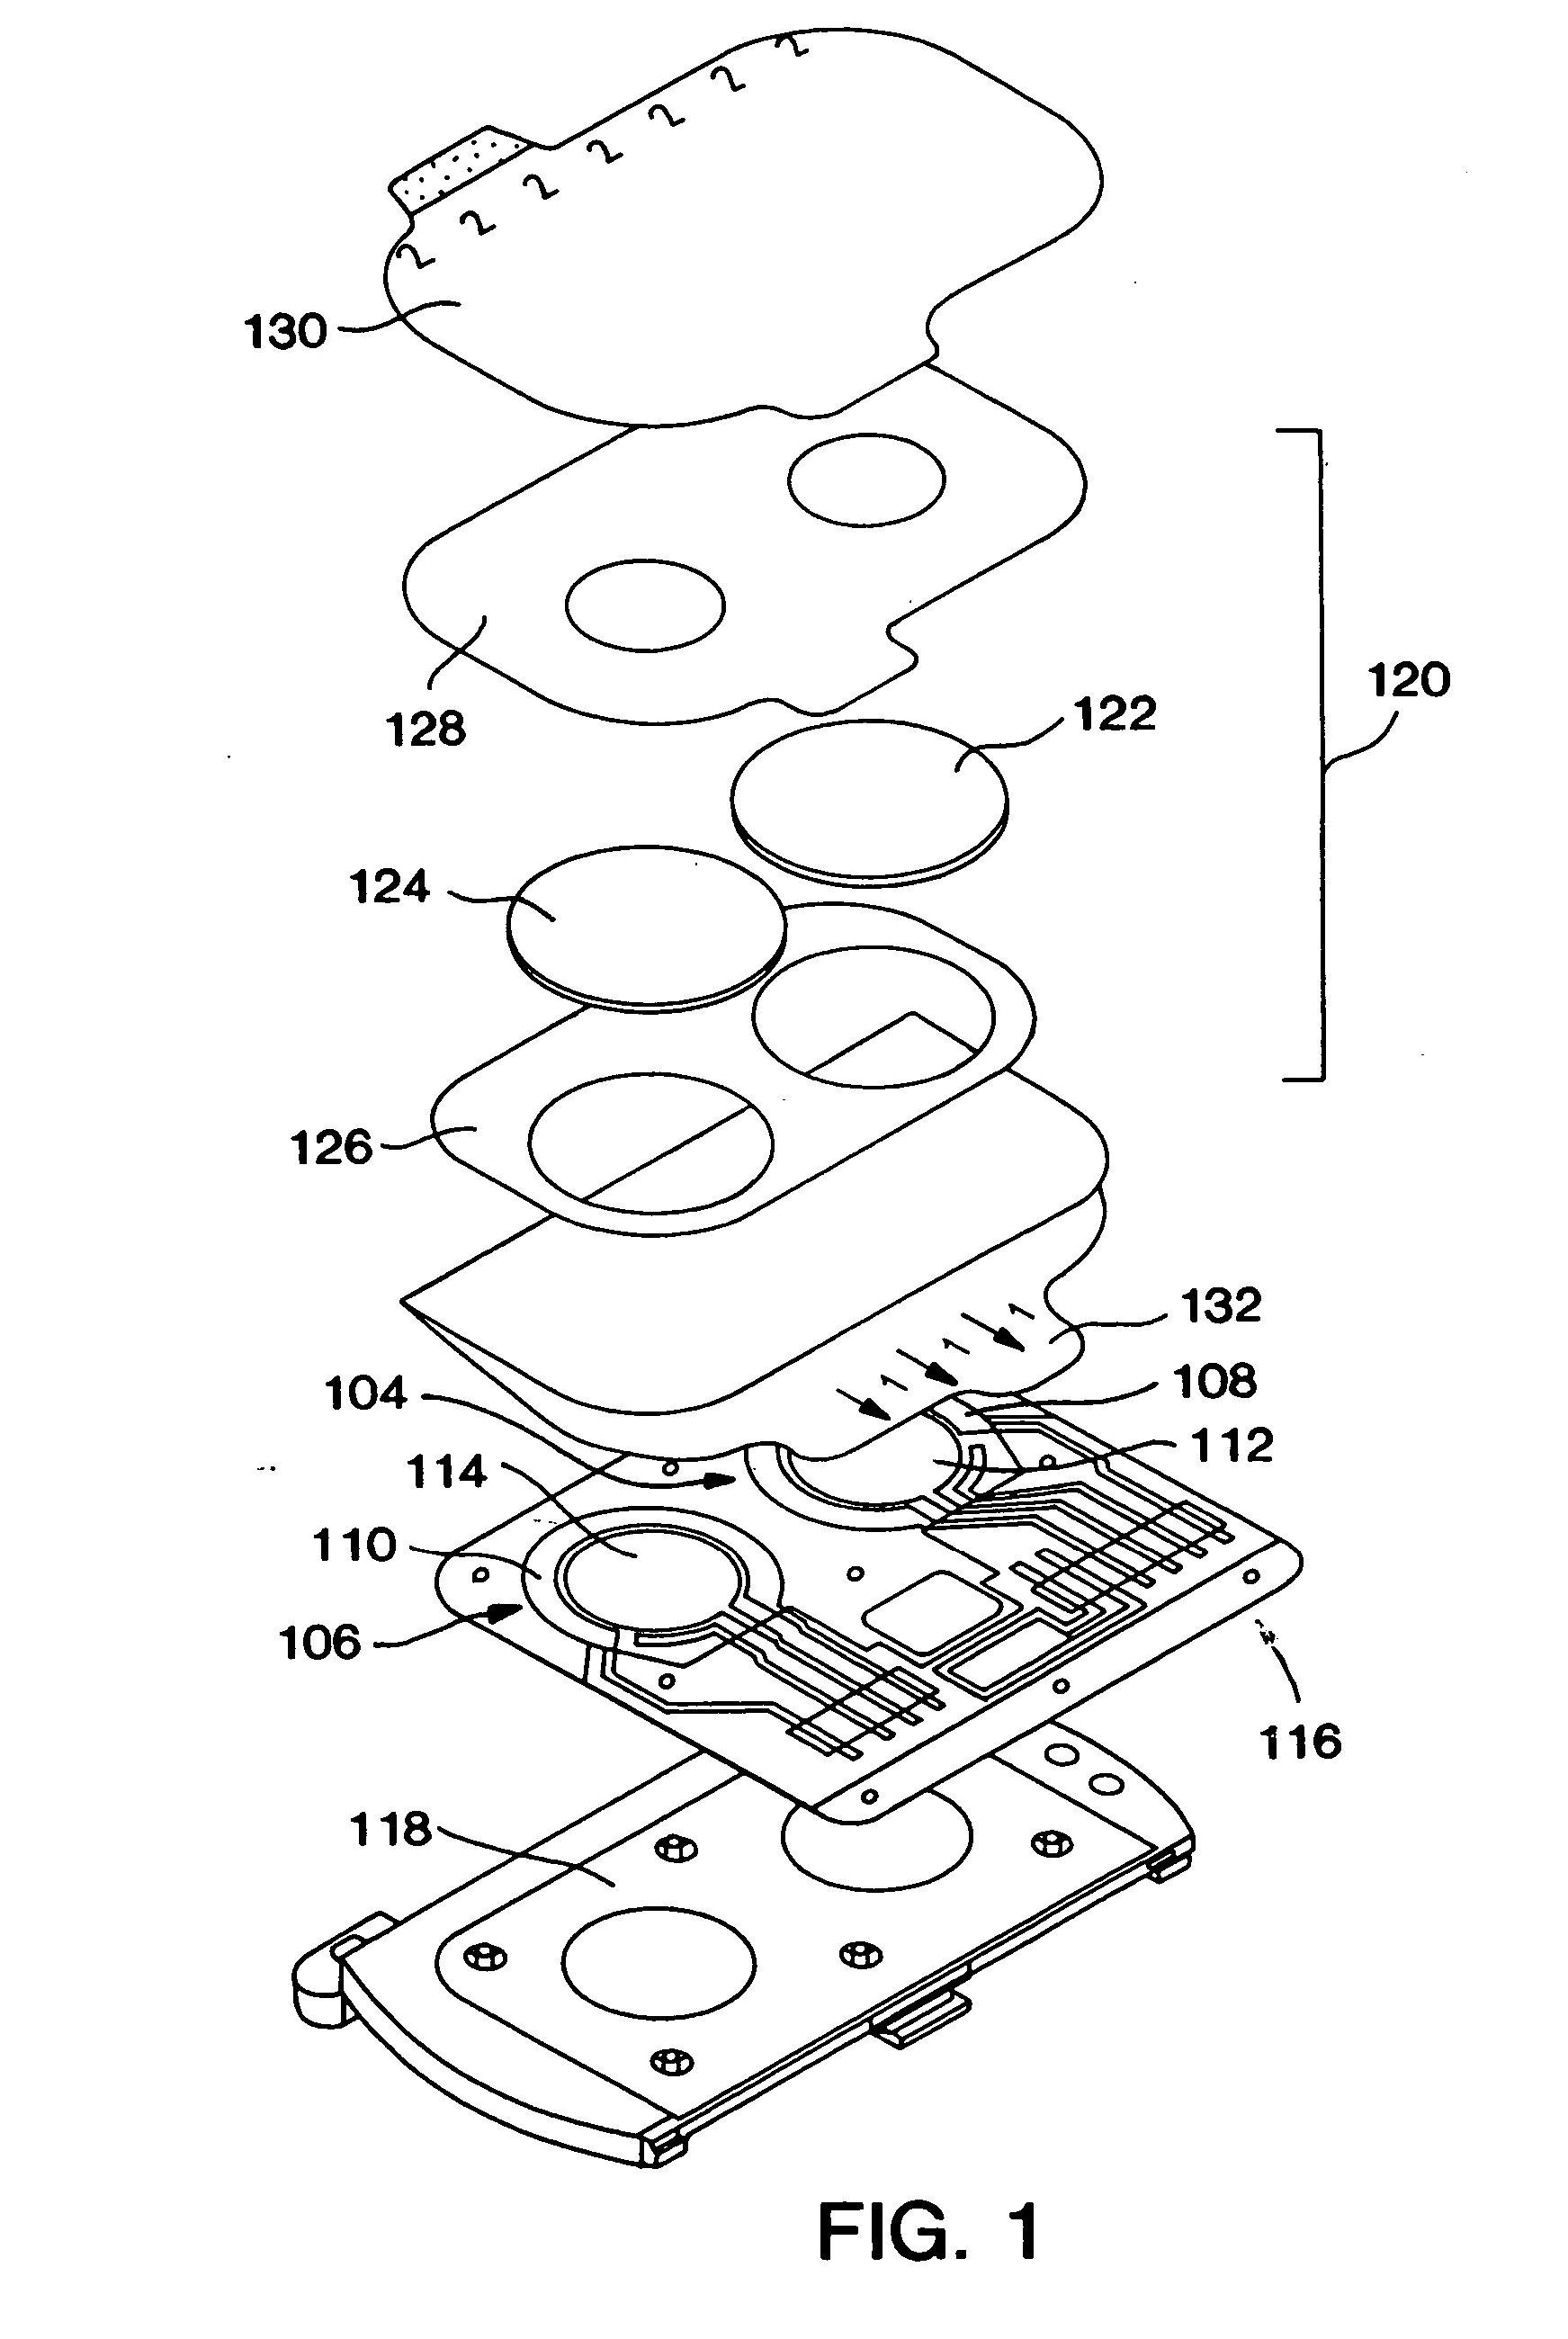
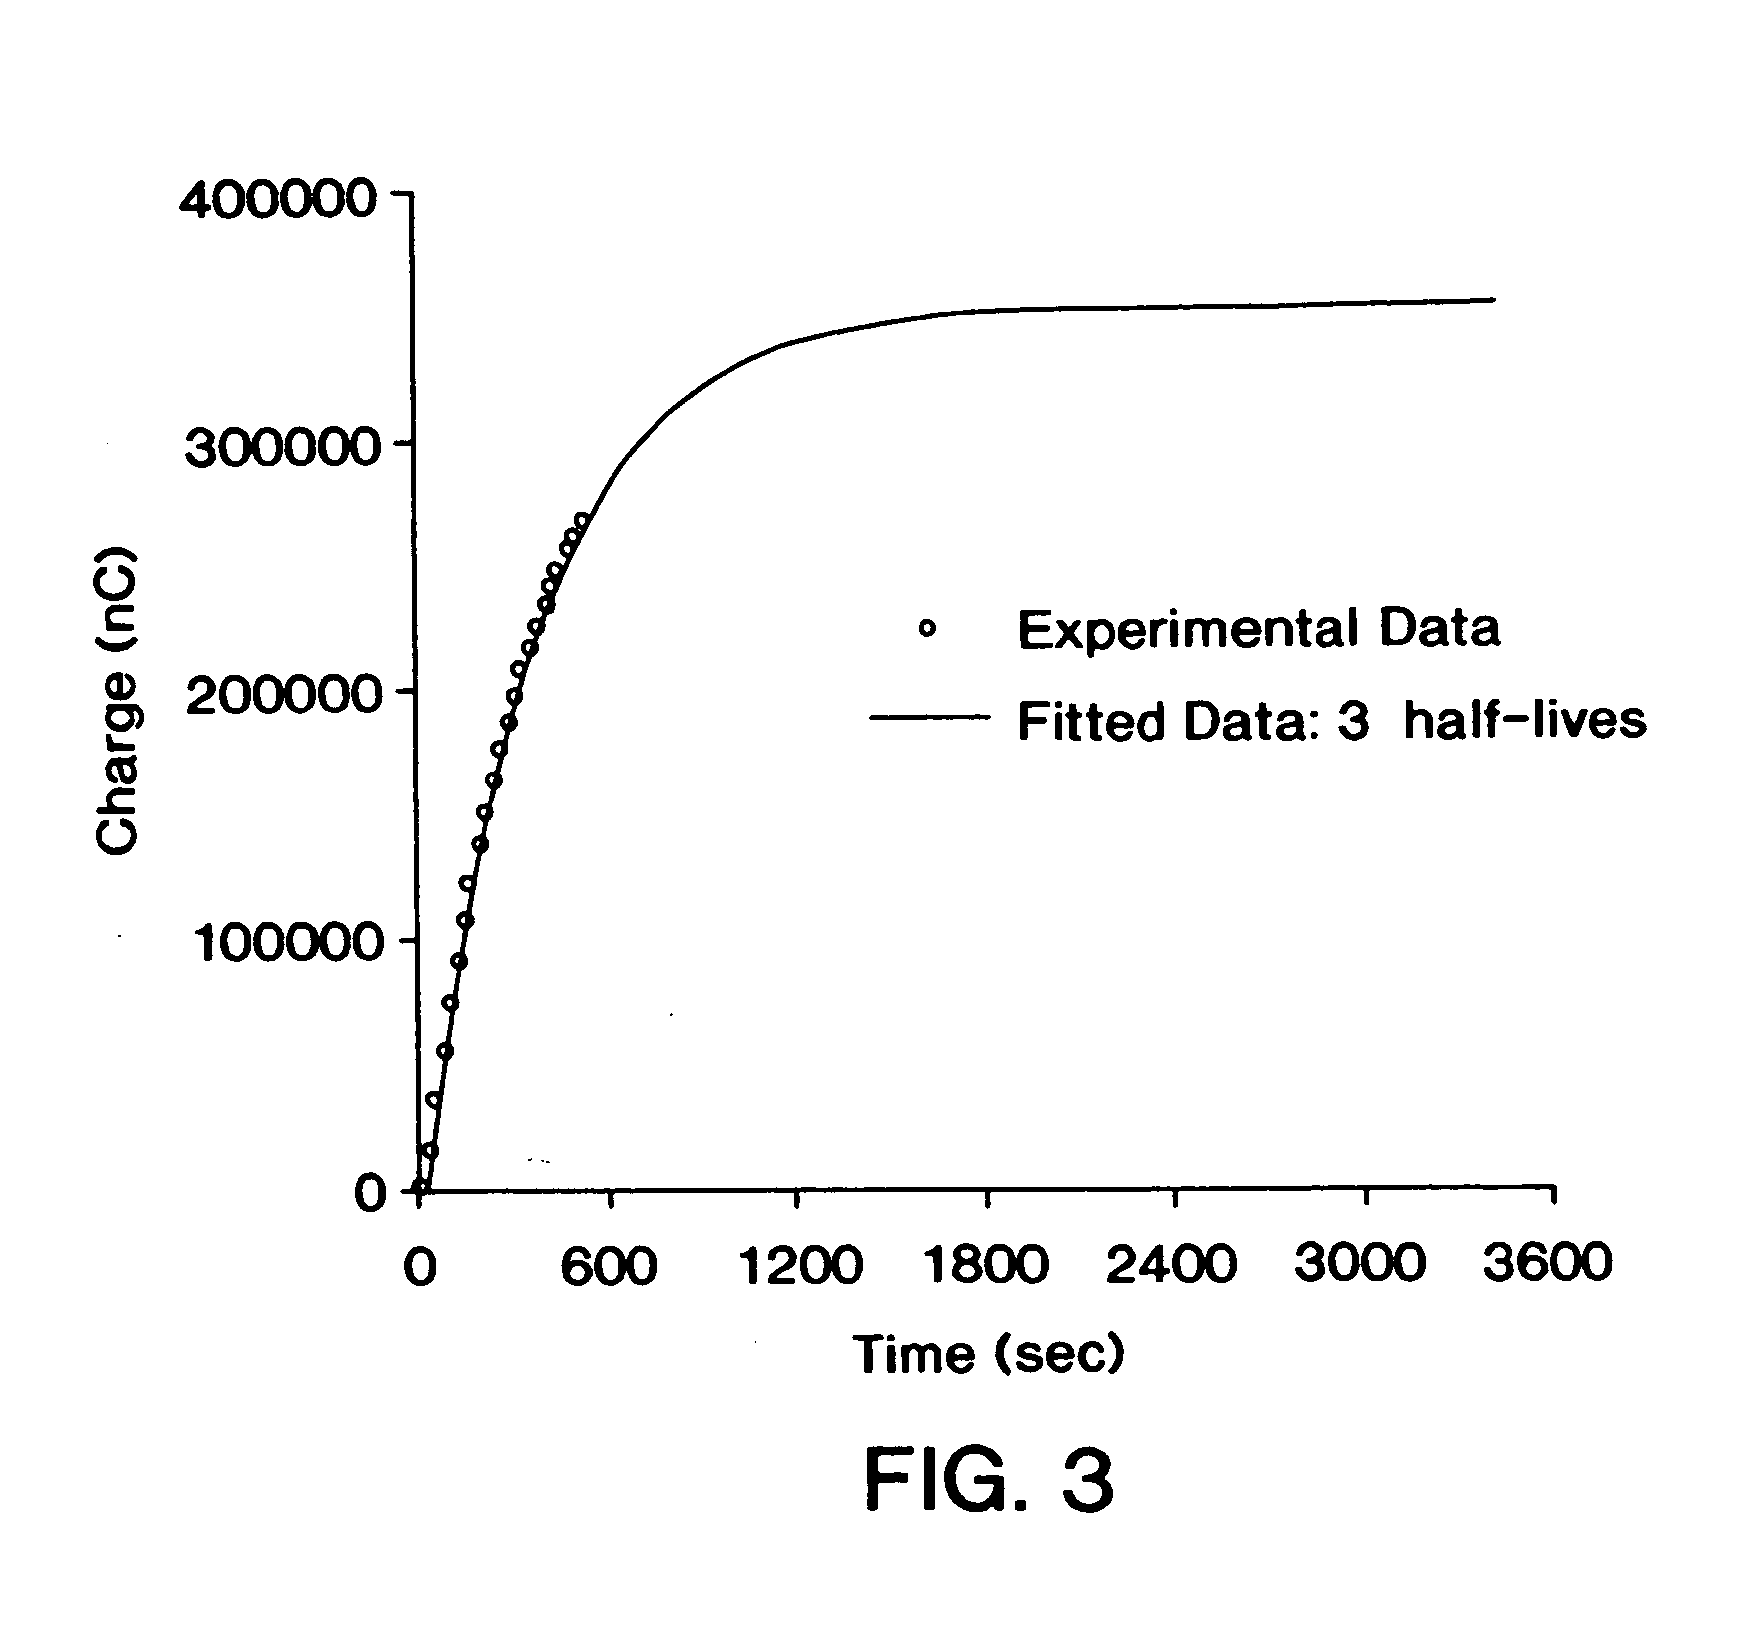
[0223] The data was collected at room temperature using the GlucoWatch biographer. In these studies, the biosensor was assembled and preconditioned for one hour. Ten microliters of glucose solution of known concentration was then deposited on the hydrogel. The electrode response to the glucose was monitored for 60 minutes. The current responses were then transferred to a computer for data processing.
[0224] In FIGS. 3 and 4, the points are experimental data for response of the biographer to 200 μmol / L glucose and the solid curve is fit to the data using the first-order model:
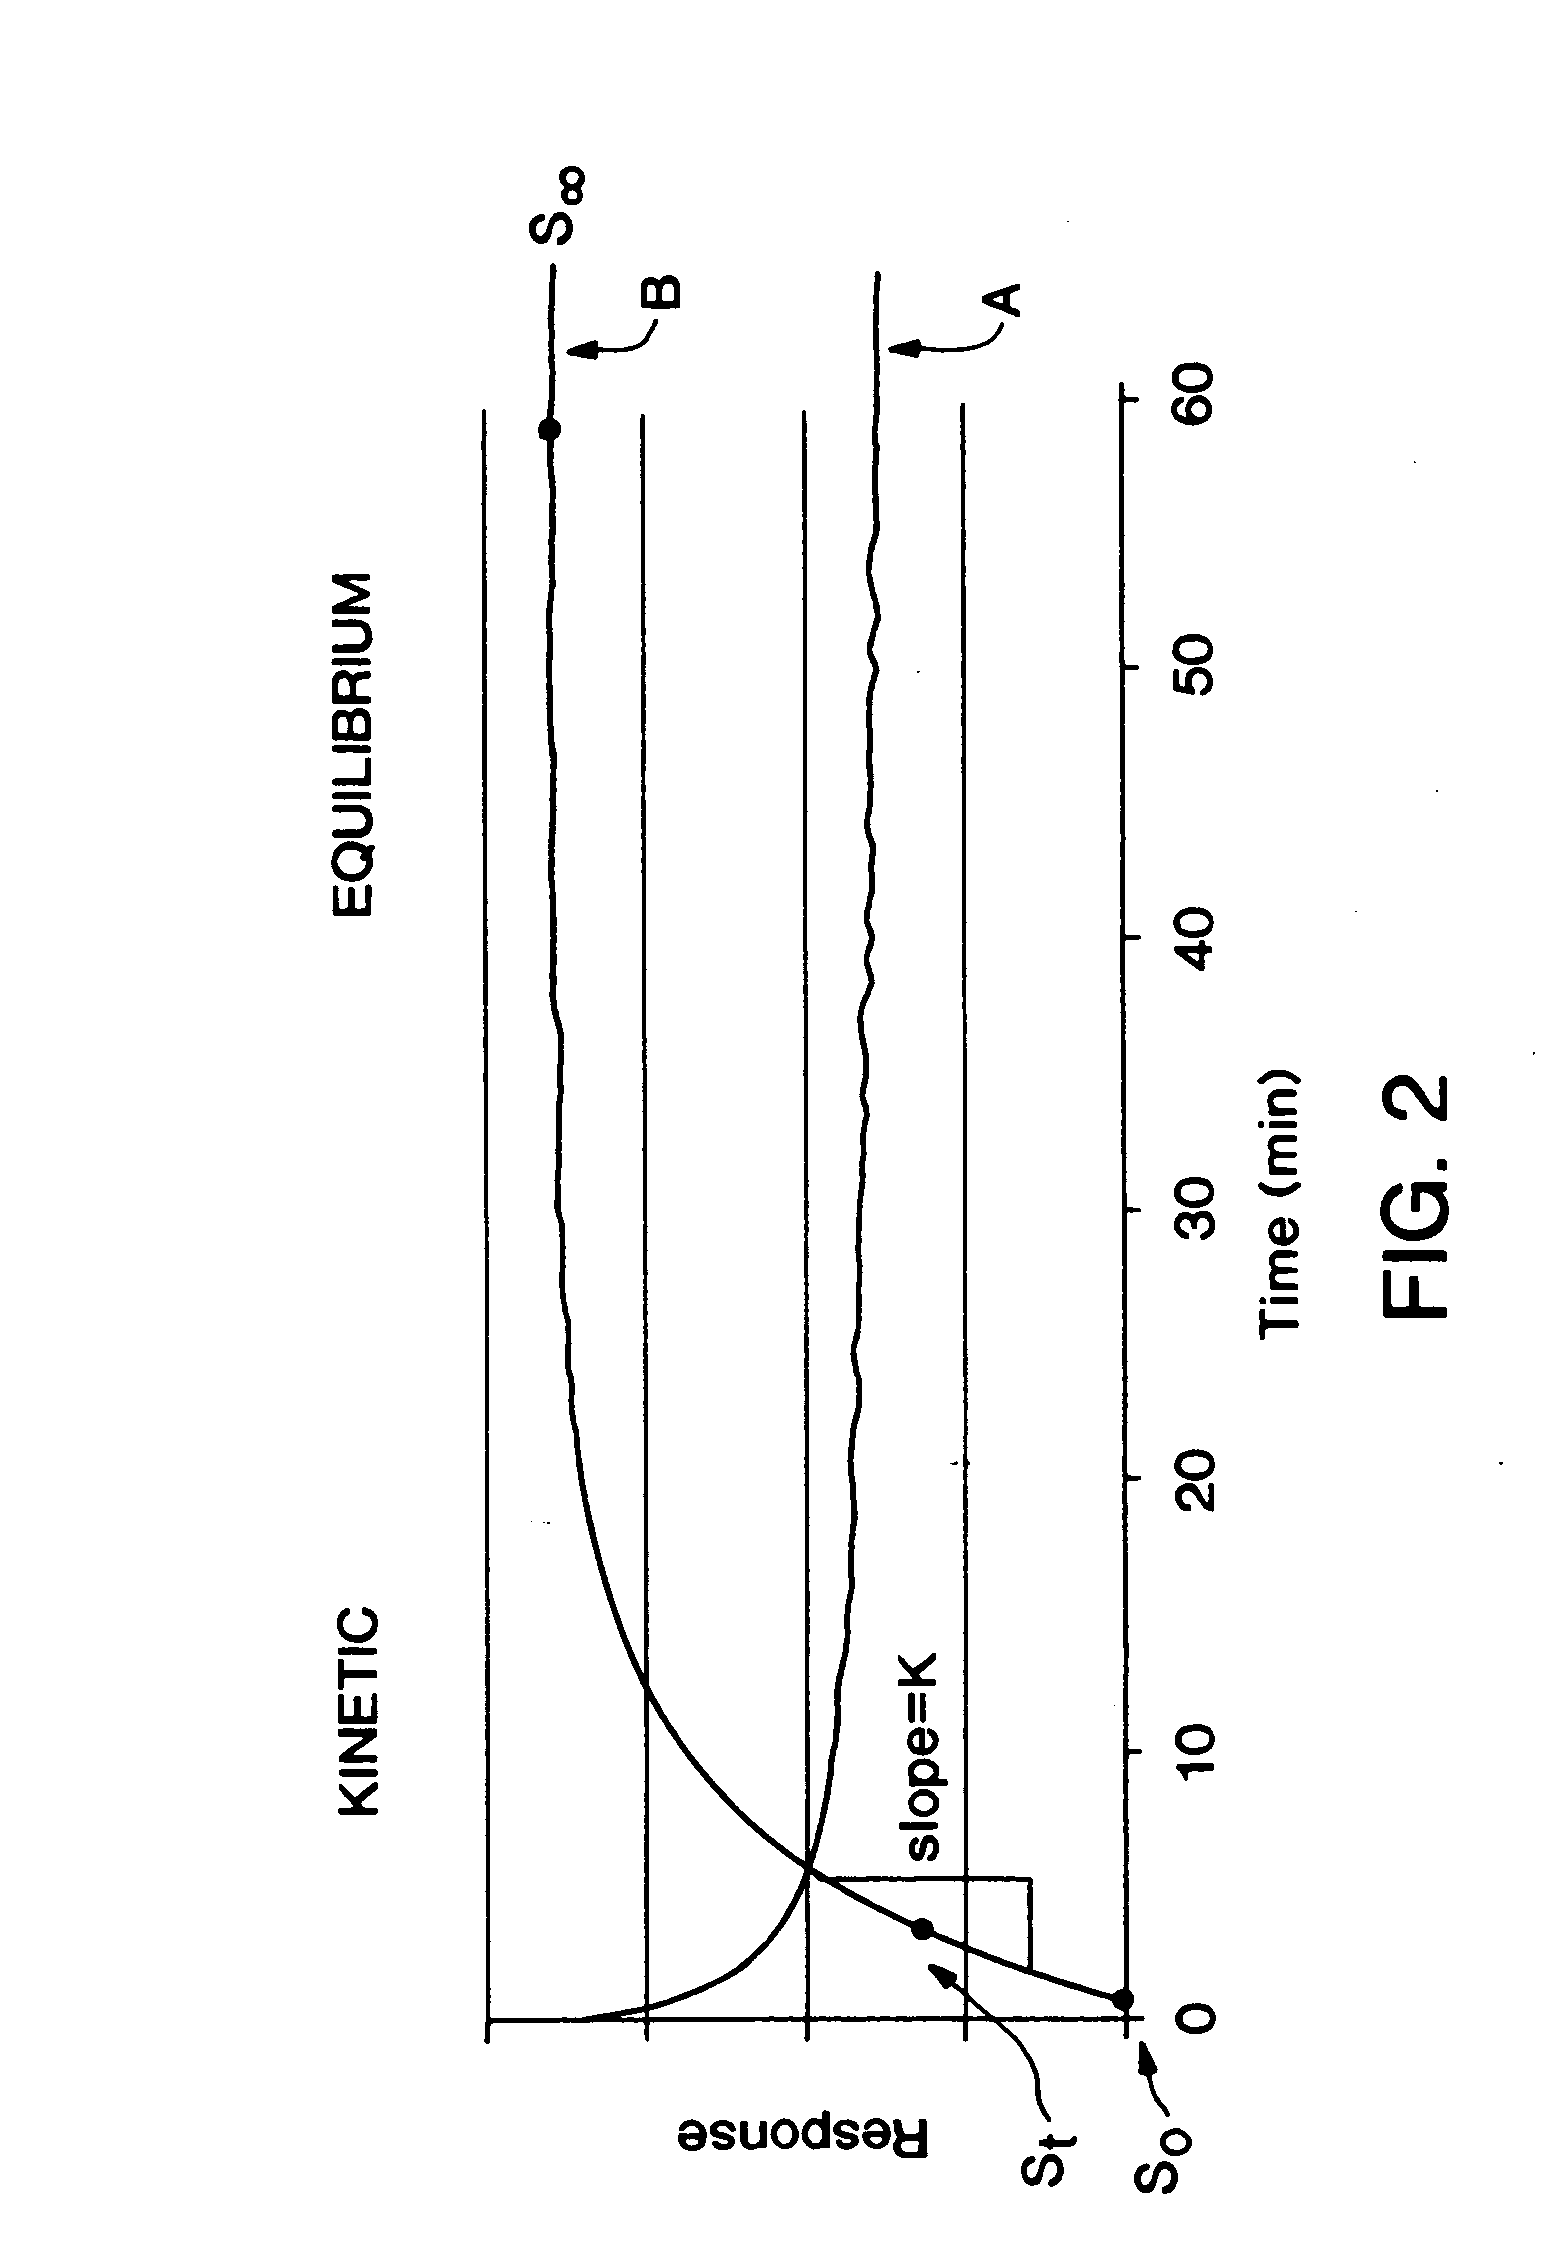
St=S∞−(S∞−So)e−kt (Eqn. 1)
where So, St, and S∞ are initial, intermediate, and final signals, k and t are the first-order rate constant and time, respectively. The experimental response was obtained by first applying preconditioning potentials at 0.77V vs. Ag / AgCl for 10 min, followed by a step down to 0.42V vs. Ag / AgCl for 50 min. At the end of the 60 min preconditioning period, 10 μL of...
example 2
Further Modeling Studies
[0228] In this study the responses of the biographer to different concentrations of glucose (25 to 200 μmol / L) was monitored using the procedure described in Example 1. The concentration range covered the extracted glucose values, as determined using a biographer, found in patients with diabetes. The experiment was performed at room temperature using sensors of moderate sensitivity. There were six replicate measurements at each concentration. The first-order model was fitted to the integrated data using several half-lives. The first half-life was 250 secs. FIG. 6 presents a plot of the predicted charge, obtained with the predictive-kinetic method, vs. the theoretical charge.
[0229] During the measurement of glucose, the biosensor current is integrated as a function of time. The integral of an electrical current is an electrical charge (Q=I×t). Because the total amount of glucose added to the biosensor in this experiment and the number of electrons released d...
example 3
First Order Versus Parallel-First Order for Fitting Clinical Data
[0236] Modeling of clinical data obtained from patients with diabetes demonstrated that the parallel multiple first order model fits clinical signal from the biographer's biosensor more accurately than first order model. This is, at least in part, because the biographer is used in such a fashion that involves at least two rate processes—initial reaction at the electrode and at least one parallel reaction, in this case where the second parallel reaction may be mutarotation and diffusion dependent. During the three-minute extraction cycle used by the biographer, glucose accumulates in the hydrogel near the reactive face of the biosensor, and once the potential is applied a large current response is observed. This gives rise to the first rate process. Further rate processes can be due to other factors such as mutarotation and diffusion of glucose through the hydrogel. These further processes are typically much slower pro...
PUM
| Property | Measurement | Unit |
|---|---|---|
| time | aaaaa | aaaaa |
| time | aaaaa | aaaaa |
| geometric surface area | aaaaa | aaaaa |
Abstract
Description
Claims
Application Information
 - R&D
- Intellectual Property
- Life Sciences
- Materials
- Tech Scout
- Unparalleled Data Quality
- Higher Quality Content
- 60% Fewer Hallucinations
Browse by: Latest US Patents, China's latest patents, Technical Efficacy Thesaurus, Application Domain, Technology Topic, Popular Technical Reports.
© 2025 PatSnap. All rights reserved.Legal|Privacy policy|Modern Slavery Act Transparency Statement|Sitemap|About US| Contact US: help@patsnap.com


