
Method for determining formation quality factor from seismic data

a technology of quality factor and seismic data, applied in the field of seismic data processing and interpretation, can solve the problems of reducing the resolution of seismic images that can be made from reflection seismic recordings, affecting the interpretation of such estimates, and noisy measurement over short intervals

Active Publication Date: 2005-04-21
PGS GEOPHYSICAL AS
View PDF1 Cites 26 Cited by
  • Summary
  • Abstract
  • Description
  • Claims
  • Application Information

AI Technical Summary

Benefits of technology

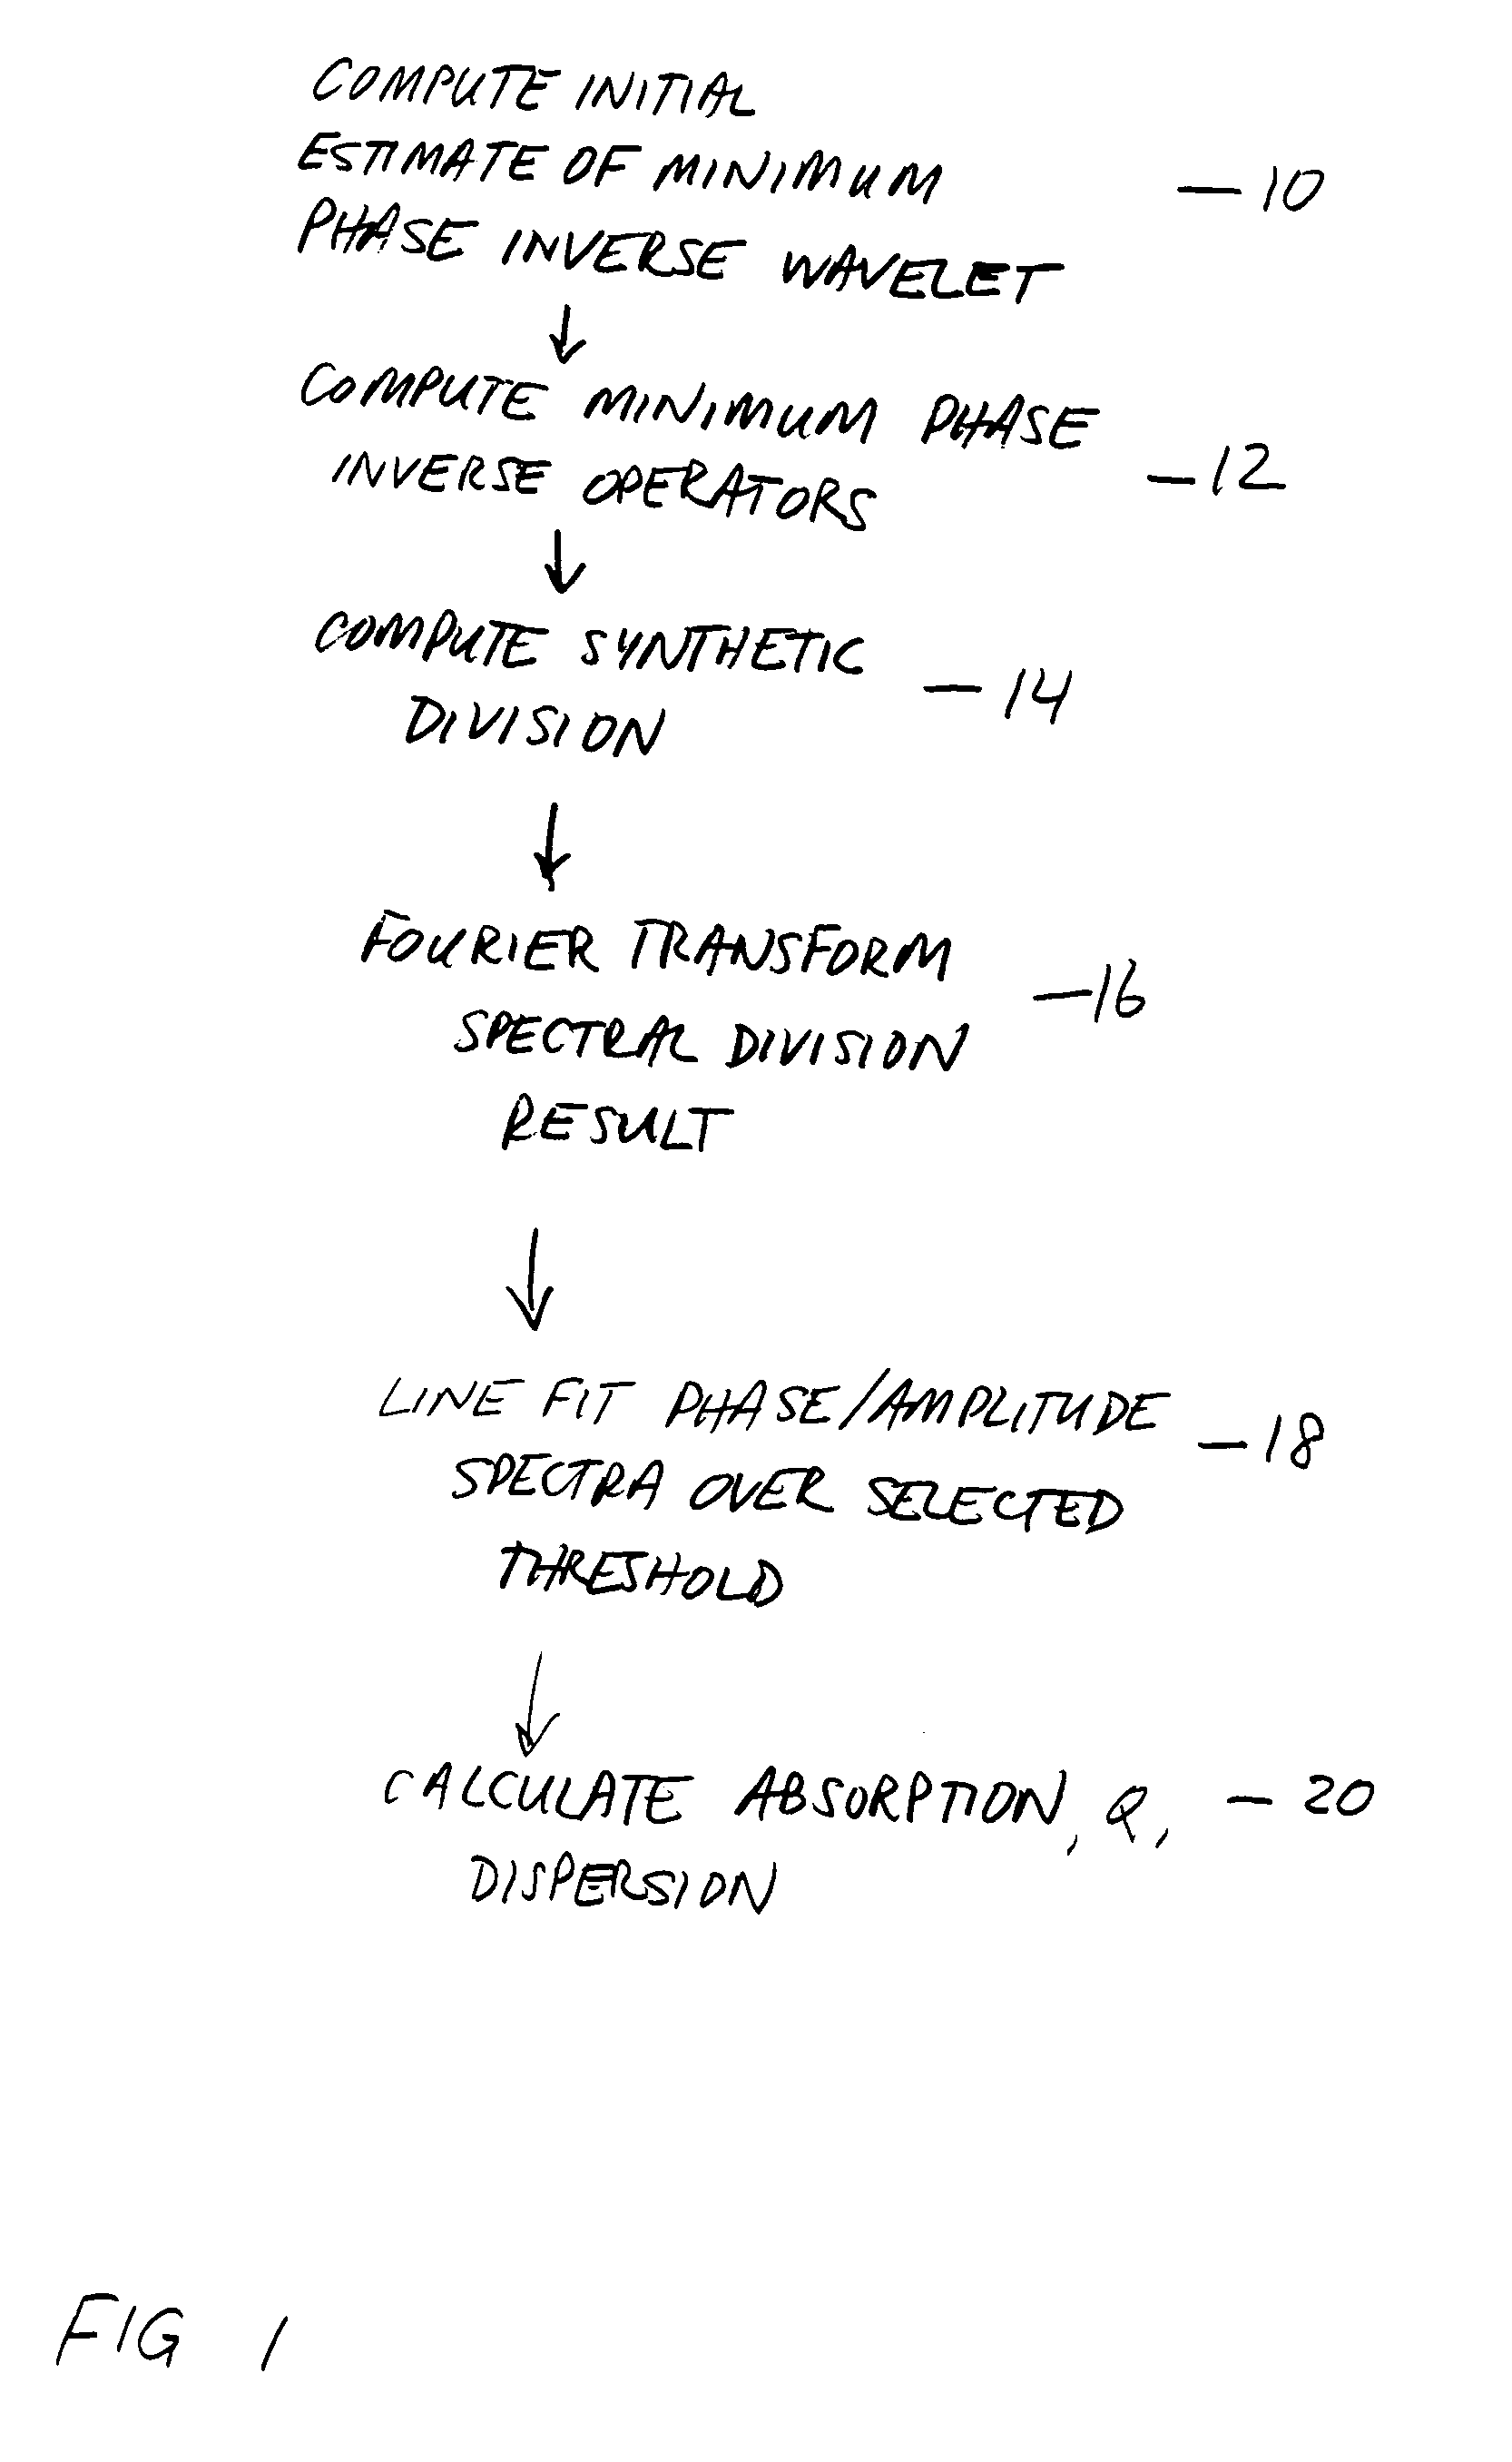
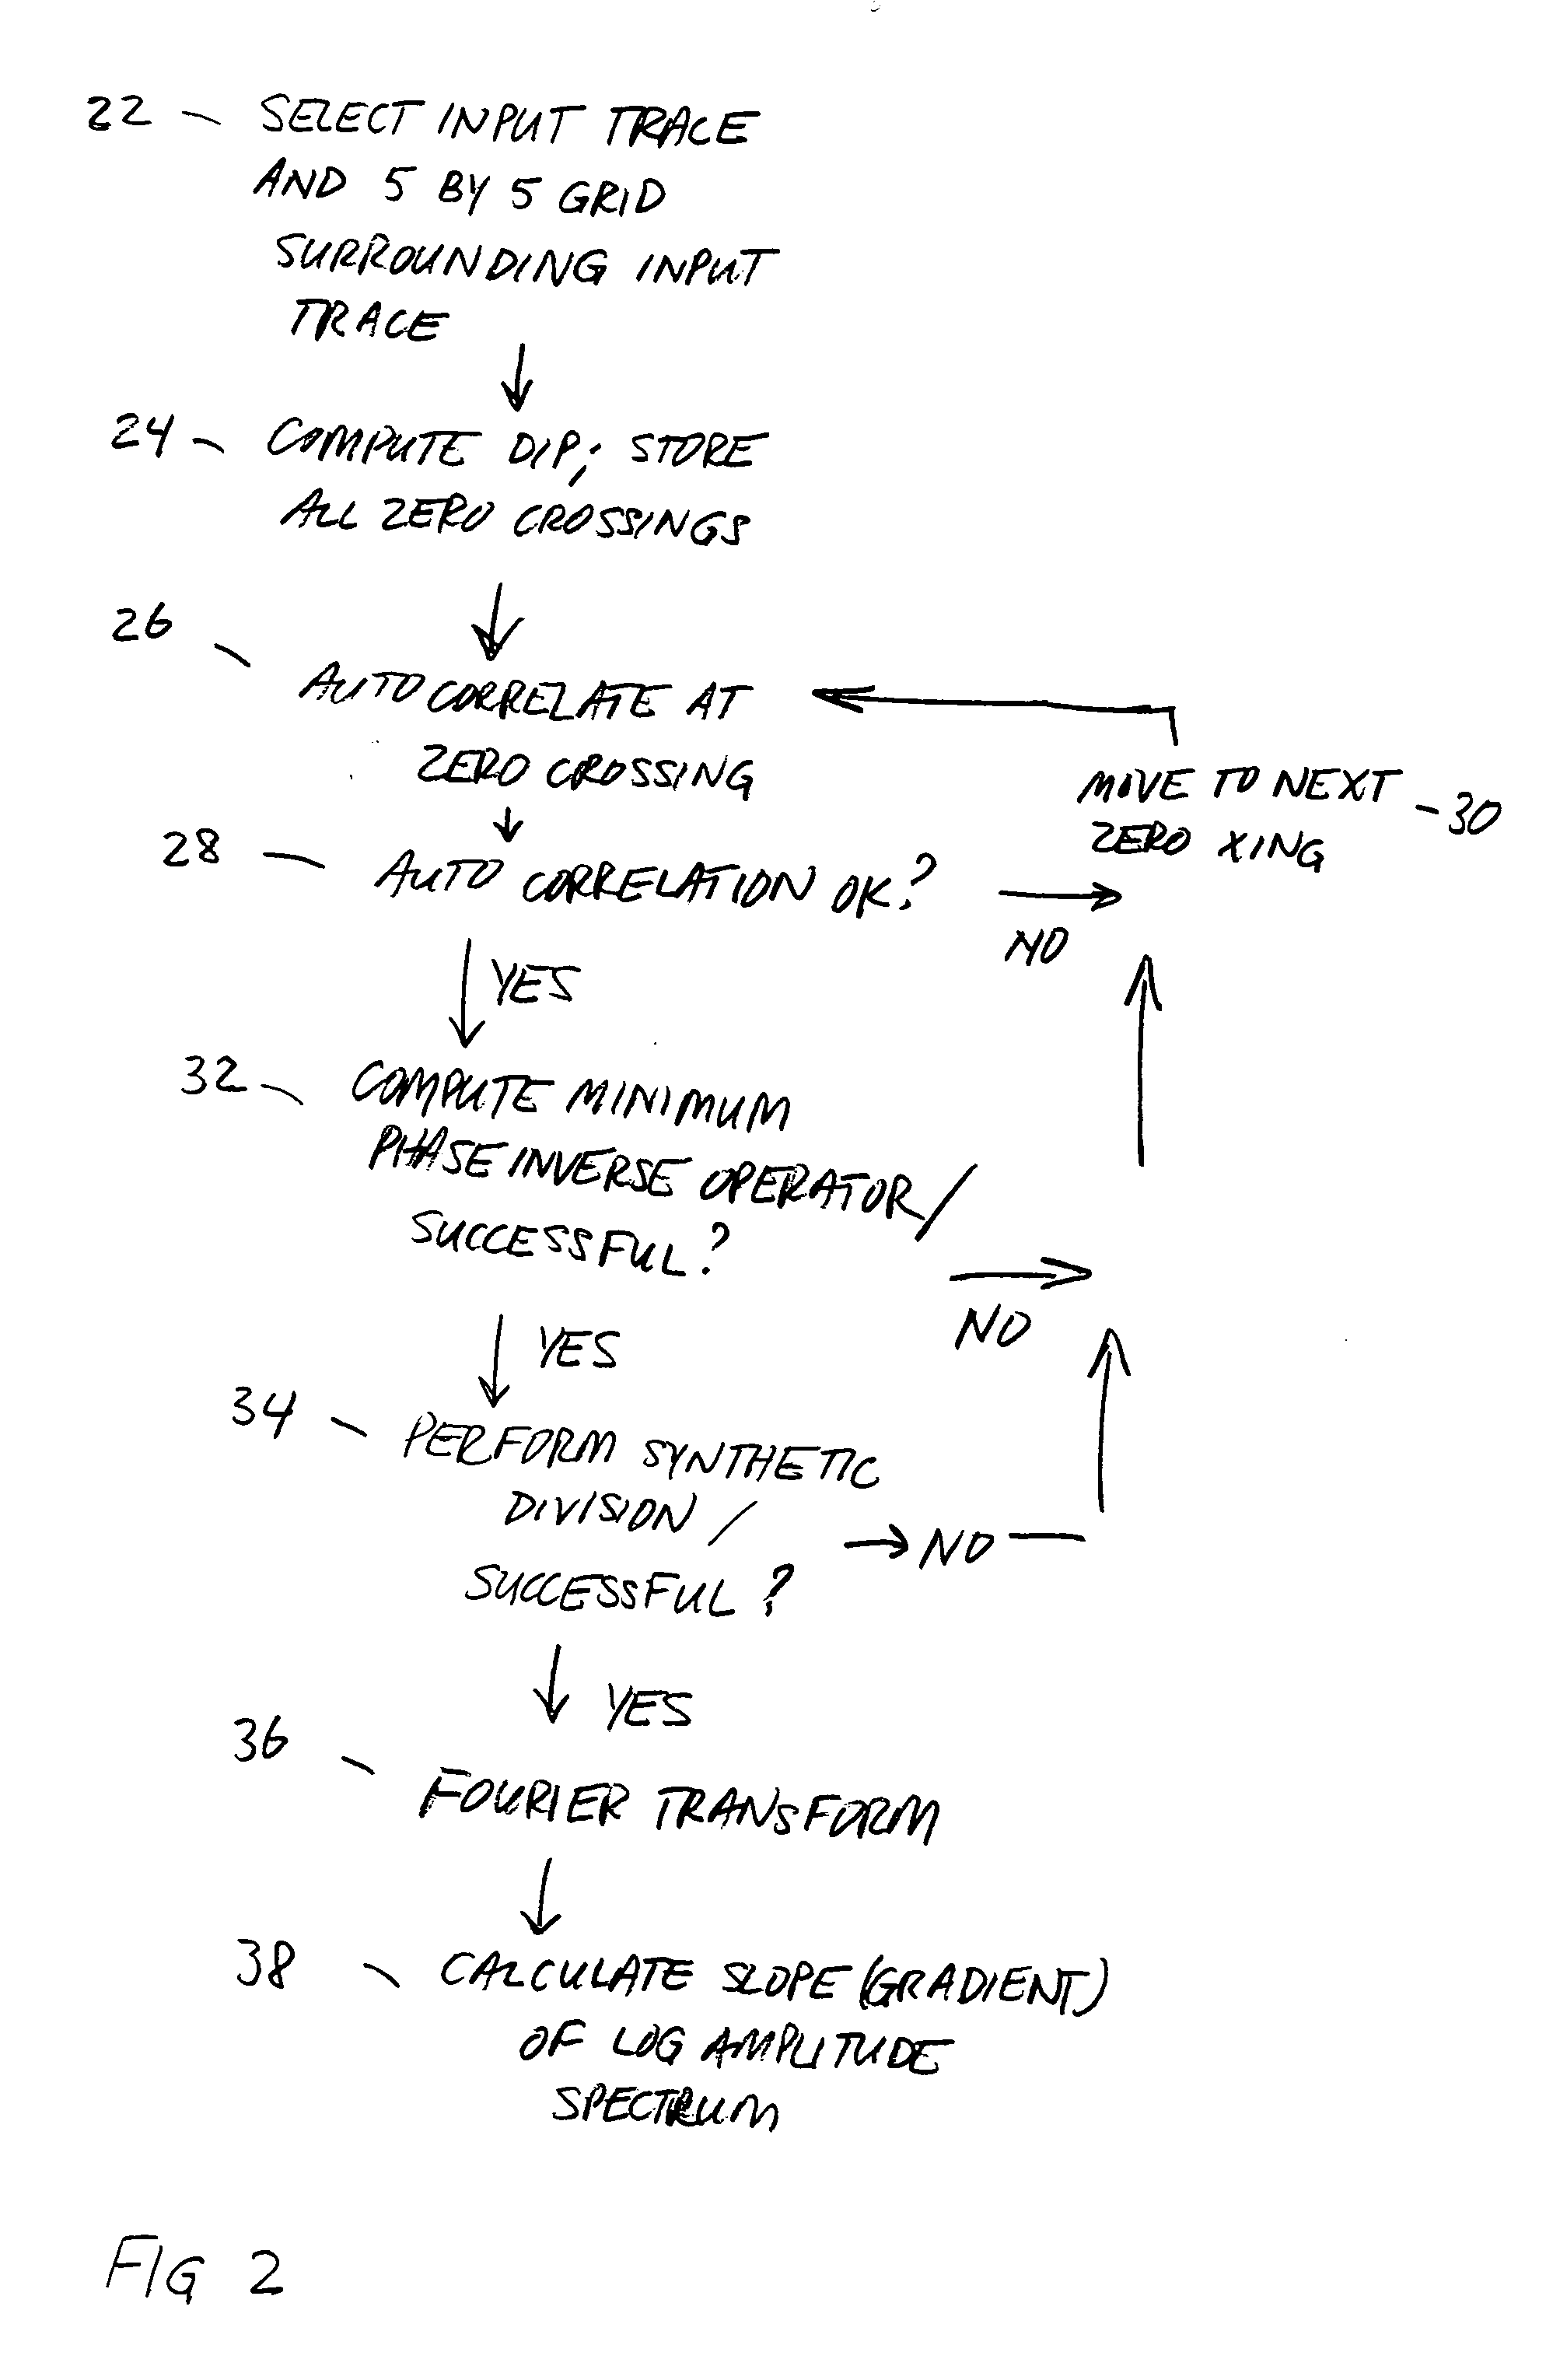
[0020] One aspect of the invention is a method for calculating the quality factor Q from a seismic data trace. The method includes calculating a first and a second minimum phase inverse wavelet at a first and a second time interval along the seismic data trace, synthetically dividing the first minimum-phase wavelet by...

Problems solved by technology

On the other hand, high frequency seismic energy losses due to absorption reduce the bandwidth of the seismic waves passing through the earth formations, and consequently reduce resolution of the seismic images that can be made from reflection seismic recordings.
Measurement over shorter intervals can be noisy to such degree that the interpretations made from such estimates may be questionable.
Spectral ratio methods, while appearing to provide the most reliable results in Q calculation, have tended to be unreliable primarily due to near zero values in the denominator spectrum used in the spectral division step implementing the spectral ratio method.

Method used


Image

  • Method for determining formation quality factor from seismic data
  • Method for determining formation quality factor from seismic data
  • Method for determining formation quality factor from seismic data

Examples


Embodiment Construction

[0026] A process according to the invention for determining the quality factor Q from seismic data begins with the assumption of a constant Q condition, that is, the quality factor Q is independent of the frequency, ƒ. In this case, the amplitude spectrum of a seismic wavelet, represented by A0(ƒ) as it originates from a seismic energy source, will be changed to A1(ƒ) due to attenuation as shown in the following expression:

|A1(ƒ)|=|A0(ƒ)•exp(−πƒt / Q)   (1)

[0027] In equation (1), t represents the seismic travel time from the seismic energy source to the target zone of interest. The quality factor Q is estimated from the natural logarithm (1n) of the amplitude spectral ratio of the seismic wavelets estimated above and below the zone of interest: ln|A1⁡(f)A0⁡(f)|=-π⁢ ⁢f⁡(t1-t0) / Q(2)

[0028] where t1 and t0 represent seismic travel times to the bottom and top of the zone of interest, respectively. A particular problem with estimating Q from the log-amplitude spectrum of equation (2) res...


PUM


Abstract

A method is disclosed for calculating the quality factor Q from a seismic data trace. The method includes calculating a first and a second minimum phase inverse wavelet at a first and a second time interval along the seismic data trace, synthetically dividing the first wavelet by the second wavelet, Fourier transforming the result of the synthetic division, calculating the logarithm of this quotient of Fourier transforms and detennining the slope of a best fit line to the logarithm of the quotient.

Description

CROSS-REFERENCE TO RELATED APPLICATIONS [0001] Not applicable. STATEMENT REGARDING FEDERALLY SPONSORED RESEARCH OR DEVELOPMENT [0002] Not applicable. BACKGROUND OF THE INVENTION [0003] 1. Field of the Invention [0004] The invention relates generally to the field of seismic data processing and interpretation. More specifically, the invention relates to methods for determining the quality factor (Q) from seismic data. [0005] 2. Background Art [0006] Seismic exploration techniques are used to locate subsurface earth formations that are likely to produce economically useful materials such as petroleum. Seismic exploration techniques include deploying one or more seismic energy sources near the earth's surface and deploying an array of seismic sensors at or near the surface in the vicinity of the one or more seismic sources. Seismic energy propagates downwardly from the source, where it may be reflected by subsurface acoustic impedance boundaries. The reflected seismic energy is detected...

Claims


Application Information

Patent Timeline
IPC IPC(8): G01V1/28G01V1/30G06F19/00
CPCG01V2210/63G01V1/306
Inventor TANER, M. TURHANTREITEL, SVEN
Owner PGS GEOPHYSICAL AS
Learn More