
Real-time outage analytics and reliability benchmarking system

a real-time outage and reliability technology, applied in the field of computer-implemented systems for electric utility analytics and reliability benchmarking of distribution system reliability, can solve the problems of insufficient data acquisition time, inability to meet the needs of customers, and inability to complete the tedious data acquisition of various utilities, etc., to achieve the effect of promoting data aggregation, reducing the amount of time, and being convenient to us

Active Publication Date: 2020-03-17
AERINET SOLUTIONS L L C
View PDF11 Cites 0 Cited by
  • Summary
  • Abstract
  • Description
  • Claims
  • Application Information

AI Technical Summary

Benefits of technology

The patent presents a computer system that provides a real-time outage analytics and benchmarking tool for utilities and benchmarking organizations. It allows users to easily import outage data from various utility databases, aggregate confidential data in real-time, and compare reliability metrics of utilities worldwide. The system also has a visualization tool for viewing outage data, a messaging tool for connecting utilities, and a calculator for consistent metrics calculation. Additionally, the patent describes a mobile app for reporting outage locations and type in real-time. Overall, the patent aims to provide a comprehensive solution for improving reliability and resilience of electric utilities.

Problems solved by technology

As a result of the diversity in the type of utilities involved (2000 plus distribution utilities exist in the U.S.), numerous challenges in standardization and consistency issues arise due to the differences in each utility's data collection methods, reliability metrics (SAIDI, SAIFI and CAIDI) calculation methodologies, major event day (MED) or exceptional event definitions, sustain (long) and momentary (short) outage definitions, and other fundamental parameters.
Consequently, as more utilities join the benchmarking group and detailed outage data are collected, the labor processing time to complete the tedious data acquisition from various utilities, analysis, and final benchmarking reports results in excess of several months.
In addition, the traditional OMS (Outage Management System) that utilities use to track outages only provides limited data analytics and reporting capabilities.
Thus, utilities spend a substantial amount of time exporting data from their OMS, creating customized outage technical reports via Microsoft Excel, Access or other programming tools, and maintaining the data integration between the customized tool and the OMS.
Such traditional procedures are slow, cumbersome, labor intensive and expensive.
Potentially, this can result in more than 1000 plus utilities combined in a single North American benchmarking project which was unattainable in the past.
Utilities are not willing to provide confidential and sensitive outage data outside of their organizations.
Consequently, utilities often do not participate in benchmarking groups / studies because of the fear of disclosing sensitive outage information.
This has been one of the critical hindrances why utility distribution reliability benchmarking has been unsuccessful in the U.S and worldwide.
The entire process is cumbersome and may take several months to complete, depending on the number of benchmarking utility participants (and re-submission of data), before the final aggregation and final reports are ready for all utilities.
Consequently, this unique intrinsic messaging SMS capability may result in spreading the invitation exponentially and potentially attracting higher number of utility participants.
The platinum edition 4414 allows the CEER to view the aggregated reliability indices of each country (that may use the Enterprise edition) but it does not allow access to the confidential outage detailed data of each utility under each country.
Lack of distribution operation solar analysis tools to maintain a reliable and resilient grid.
Without the CTG, the adoption of new methodologies and tools may potentially take years which is counterproductive to the DOE Sunshot goal of accelerating hundreds of gigawatts of solar power in the grid.
The rate of dissemination, adoption of the new solutions and transfer of knowledge to the 2000+ US distribution utilities is relatively slow and insufficient to meet the aggressive goal of Sunshot.
Numerous additional challenges include: the amount of time and effort to educate 2000+ utilities; connecting to the proper utility personnel; lack of scalable mechanism to disseminate the new solutions to the utilities; and lack of information about the state of PV integration readiness in the 2000+ U.S. utilities.
Another major challenge is that utilities are relatively conservative in adopting new solutions unless they see evidence that other utilities have successfully used and verified the new tools.
Part of the challenge in making this happen is the lack of electric utility solar benchmarking platform to gather pertinent information about the electric utility's existing PV projects, technical and regulatory issues, innovative solutions, PV best practices, and more.
Utilities have difficulty connecting directly to other utilities and inquire about PV best practices and solutions.
Finally, the third challenge is the lack of distribution operation and solar analysis tools to maintain a reliable and resilient grid.
There is insufficient distribution operation analysis tool that integrates the advanced tools created by NREL, Sandia, and EPRI to the distribution operation side that maintains the system reliability metrics such as SAIDI (System Average Interruption Duration Index), and SAIFI (System Average Interruption Index)

Method used


Image

  • Real-time outage analytics and reliability benchmarking system
  • Real-time outage analytics and reliability benchmarking system
  • Real-time outage analytics and reliability benchmarking system

Examples


Embodiment Construction

[0070]While preferred embodiments of the invention have been shown and described herein, it may be obvious to those skilled in the art that such embodiments are provided by way of example only. Numerous variations, changes, and substitutions may now occur to those skilled in the art without departing from the invention. It should be understood that various alternatives to the embodiments of the invention described herein may be employed in practicing the invention.

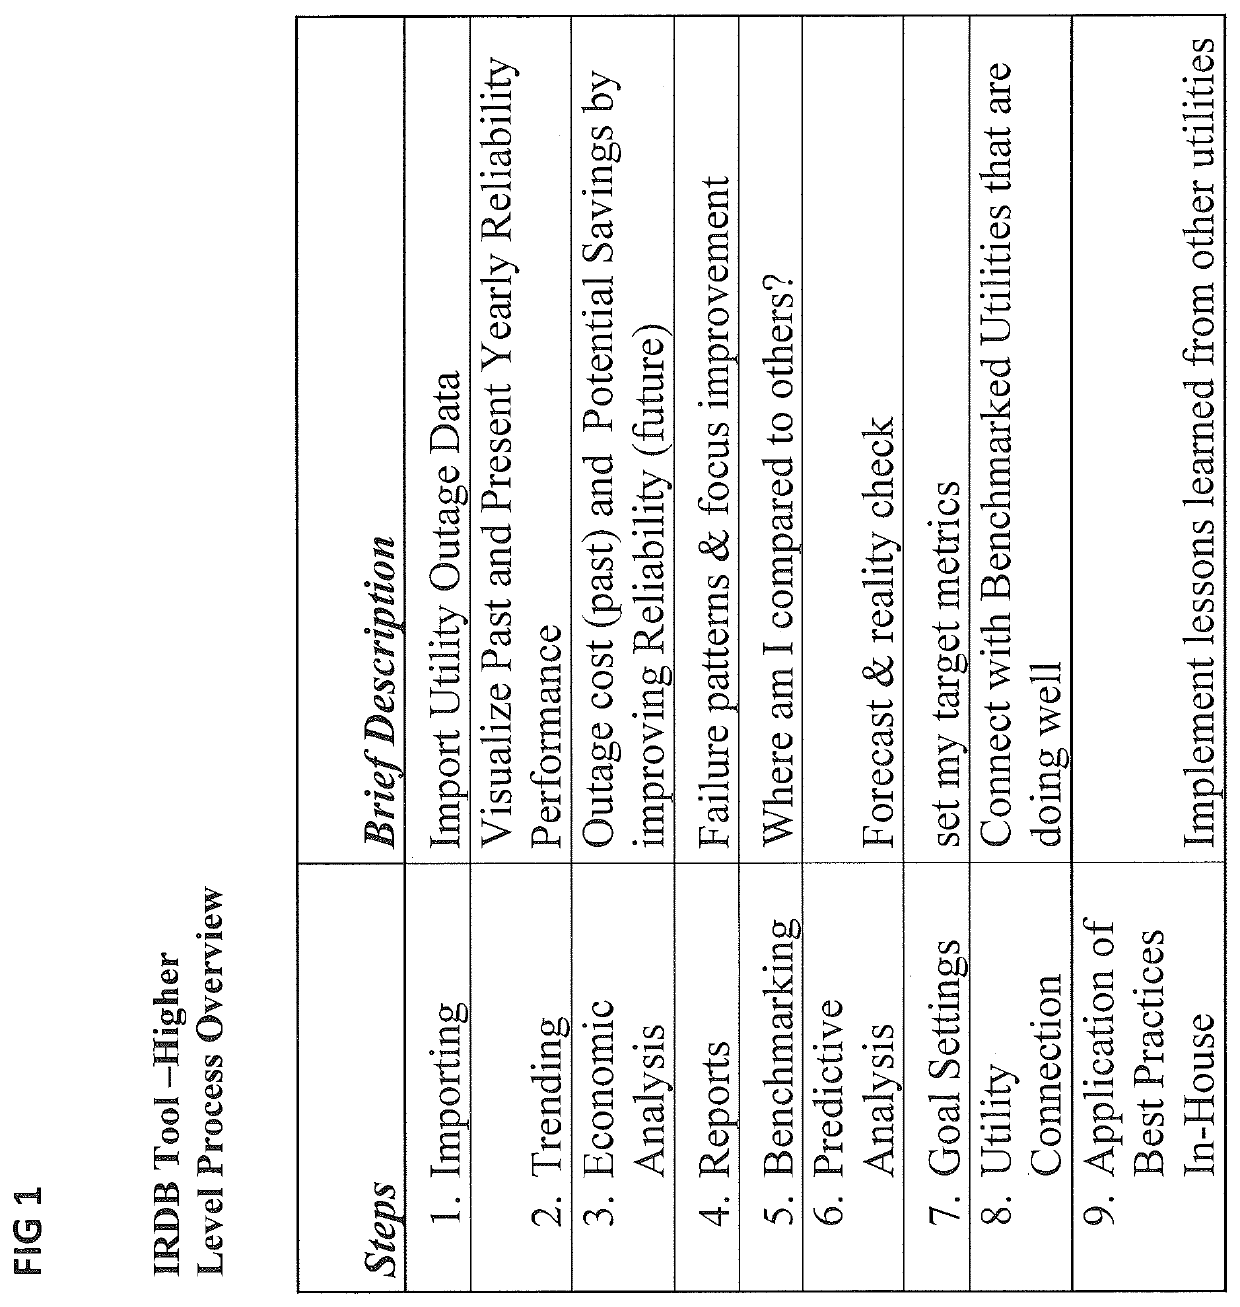
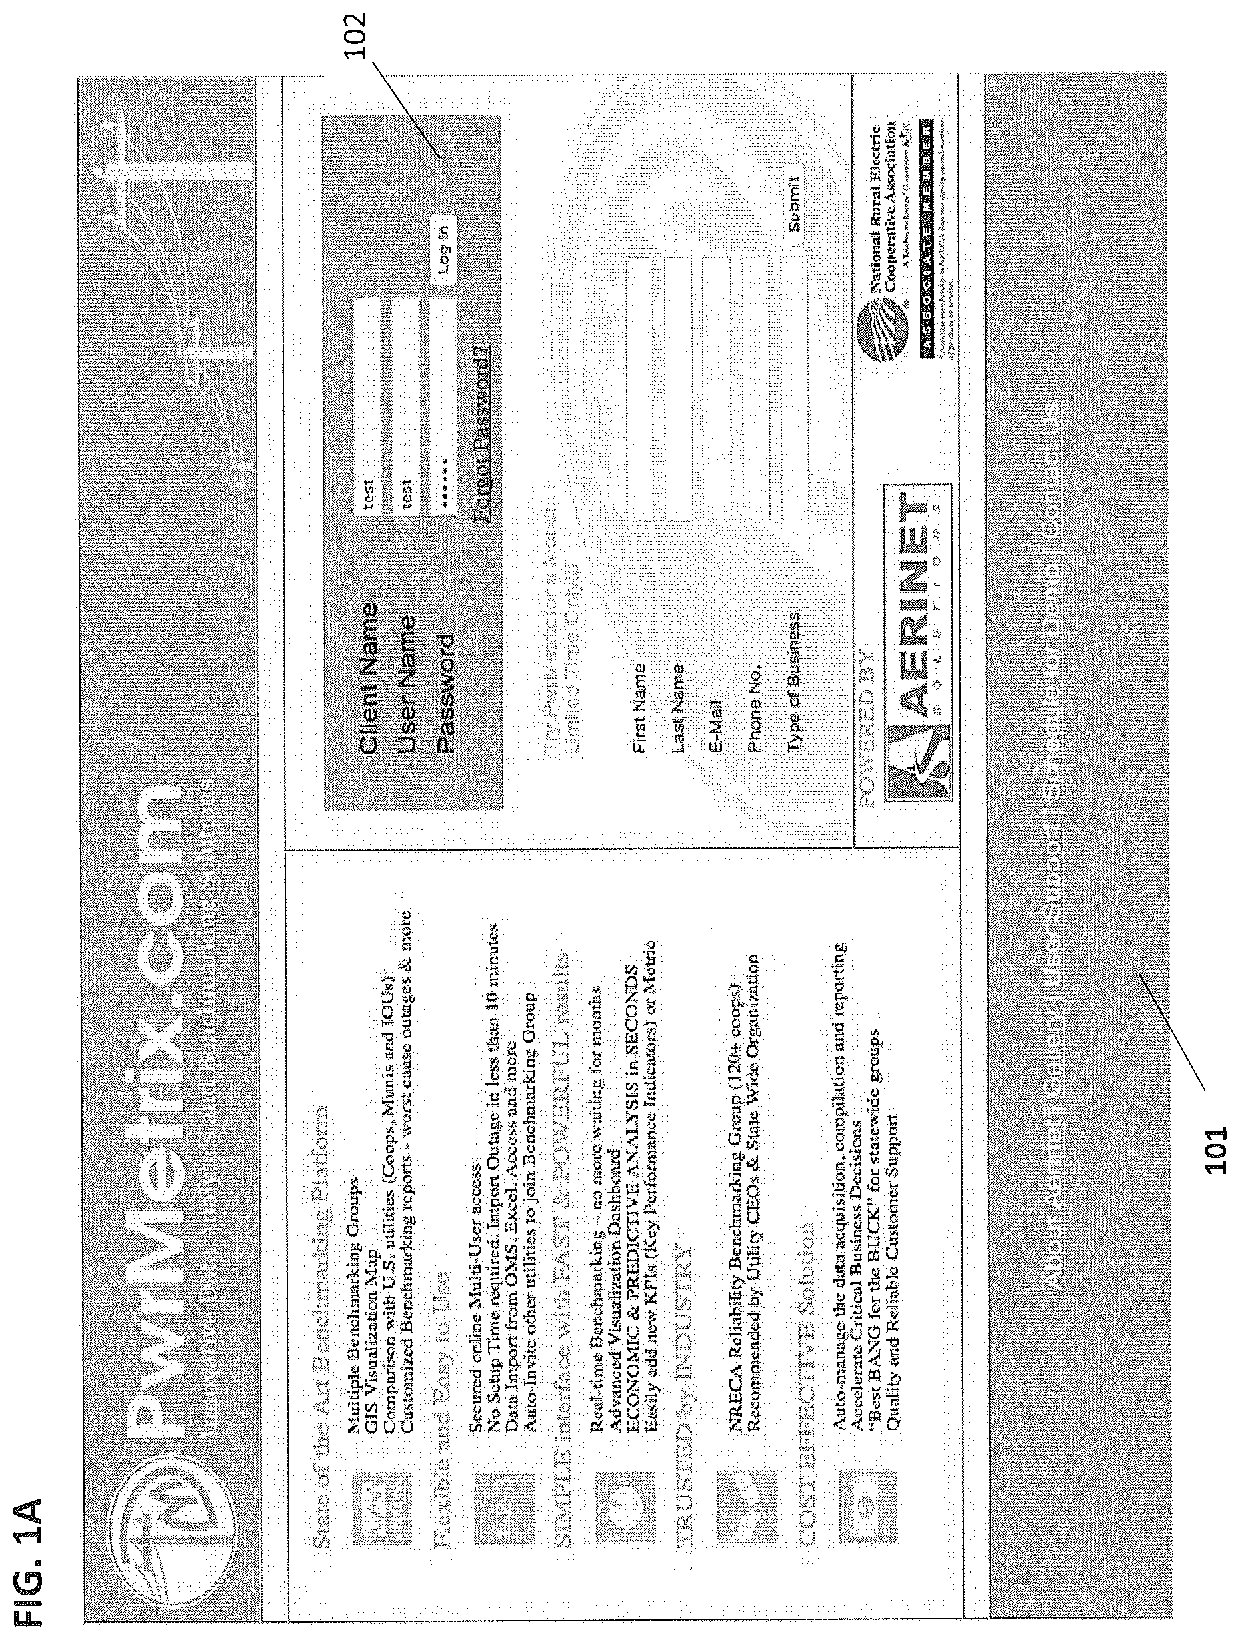
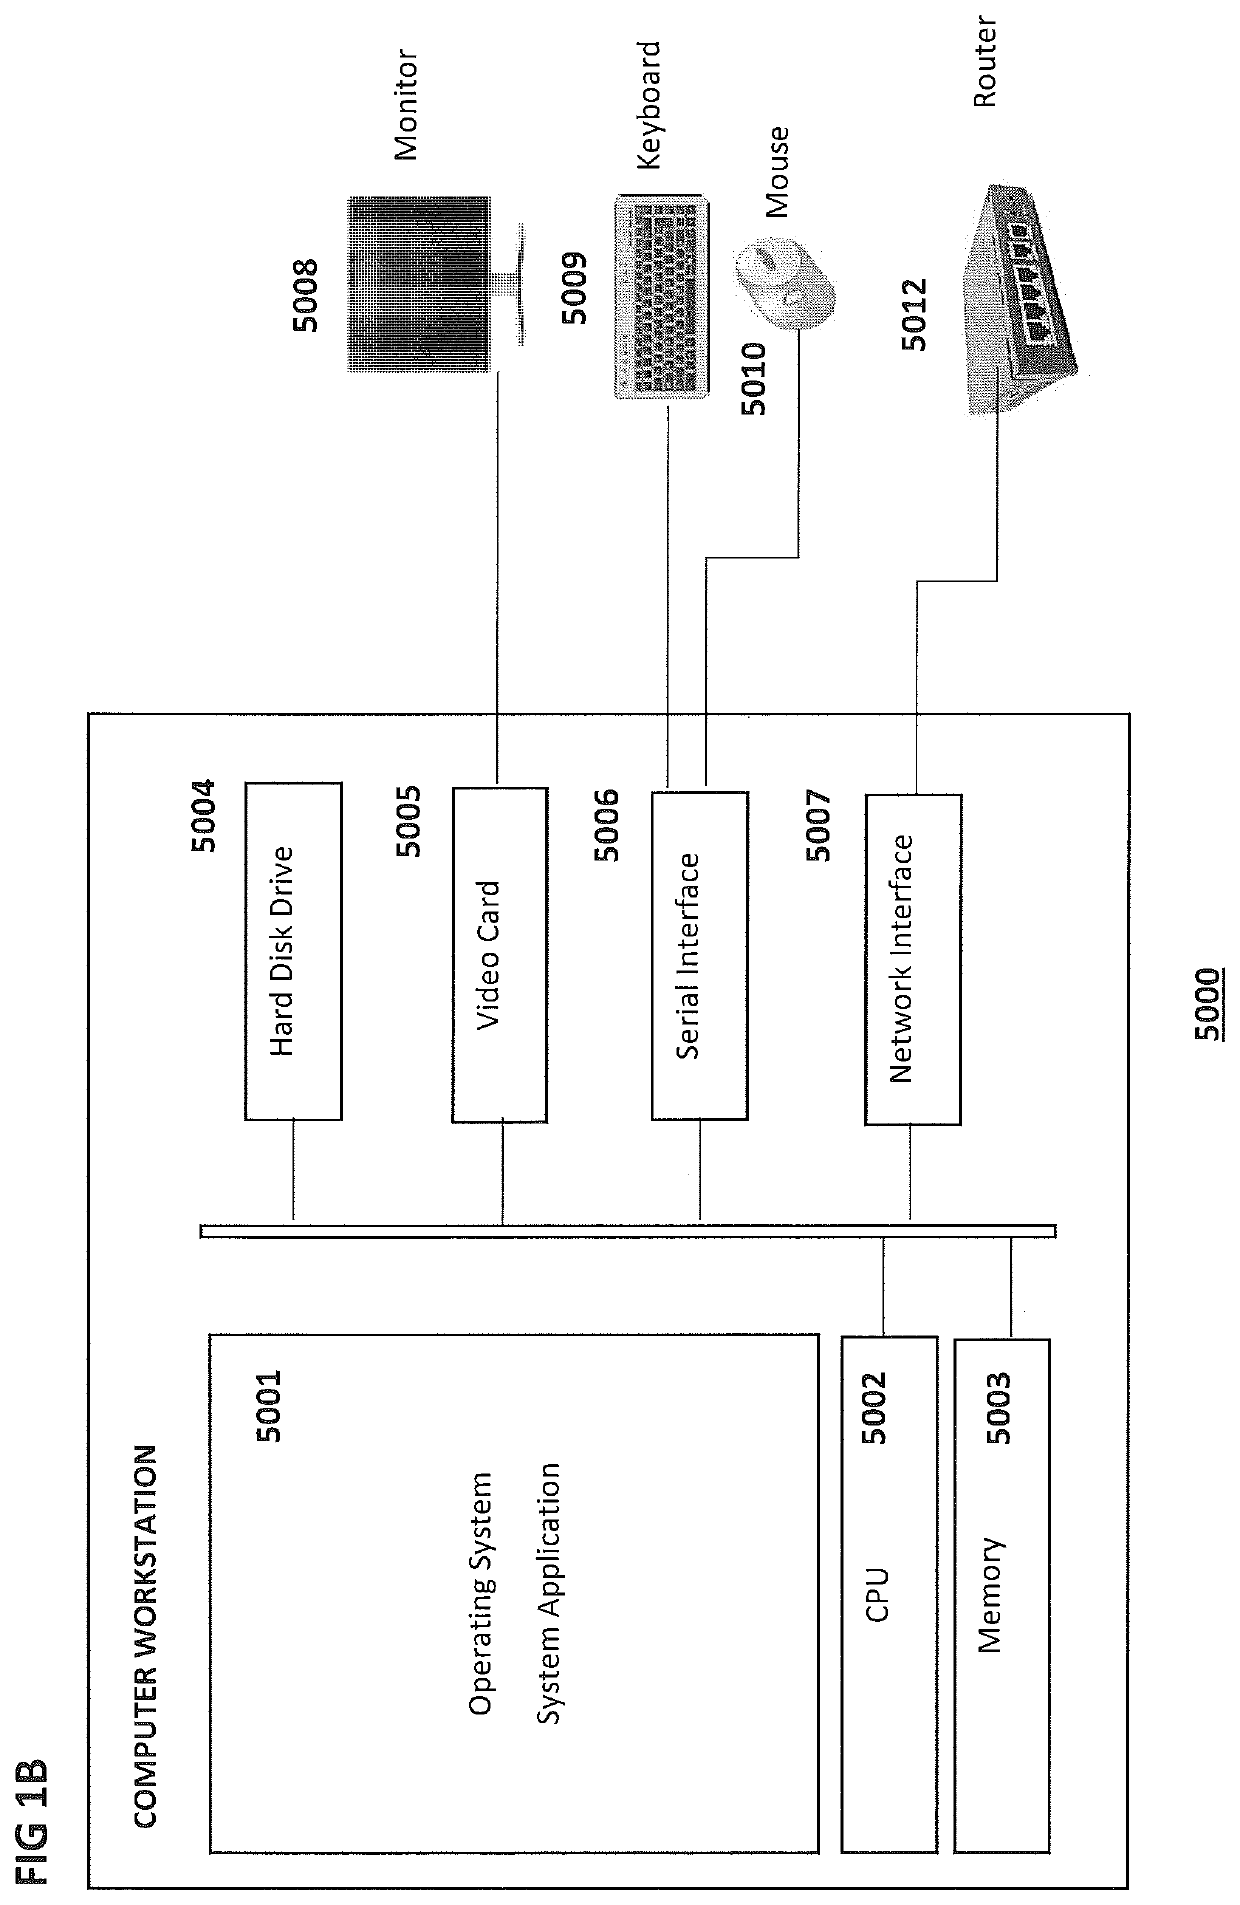
[0071]The invention provides is a computer implemented system for providing electric utilities and benchmarking organizations an integrated real-time outage analytics and benchmarking web solution framework in accordance with aspects of the invention. Various aspects of the invention described herein may be applied to any of the particular applications set forth below or for any other types of data analytics and benchmarking system. The invention may be applied as a standalone system or method, or as part of a service, too...


PUM


Abstract

System and method for providing electric utilities and utility benchmarking organizations with an integrated real-time outage analytics and benchmarking solution. The system includes a powerful data importing apparatus that allows uploading of outage data from the utilities outage databases, confidential aggregation of utility outage data, real-time comparison of reliability metrics, real-time outage analytics and messaging capabilities. The system includes a communication link for receiving raw outage data uploaded from the outage management systems of participating utilities which couples the data to an analytics server which automatically recalculates standard reliability indices and analytics in real-time. A database server aggregates and stores the data and indices. The analytics server makes data and reports available to user utilities in real-time via the internet while using a unique ID for each user utility to maintain user anonymity and data confidentiality.

Description

CROSS REFERENCE TO RELATED APPLICATION[0001]This application claims priority to U.S. Provisional Patent Application No. 62 / 281,852, filed Jan. 22, 2016 which is incorporated herein by reference.FIELD OF INVENTION[0002]The present invention is in the technical field of computer-implemented systems for electric utility analytics and benchmarking of distribution system reliability.BACKGROUND[0003]Electric utilities (“utilities”) worldwide are restructuring and moving toward a competitive environment where accurate information about distribution system performance is required to ensure that capital expenditures and maintenance dollars are spent appropriately to provide safe, reliable and cost effective power to the customers. To measure distribution system reliability performance, the electric utility industry has developed several reliability performance measures. Three of the most commonly used reliability indices / metrics include measures of outage duration (SAIDI System Average Inter...

Claims


Application Information

Patent Timeline
Patent Type & Authority Patents(United States)
IPC IPC(8): G06F16/951G06Q50/06
CPCG06Q50/06G06F16/951Y04S20/36Y04S20/30
Inventor RAZON, ALVIN M.ILAO, EDUARDOILAO, JOHN
Owner AERINET SOLUTIONS L L C
Learn More