


Quick Research
Generate reliable direction feasibility study reports for your R&D in just a few steps.

Technical Q&A
Discover and master advanced knowledge NOW. Basics, ideas, possibilities, all at once.

Find Solutions
As an expert in R&D theories, this can generate solutions to your technical problems instantly.

Evaluate Feasibility
Analyze your overall solution with one click, know your potential R&D risks in advance.

Monitor Landscape
Get weekly tech updates, stay abreast of the latest tech innovations and key insights.
Display method of data analysis chart, electronic equipment and readable storage medium
A data analysis and display method technology, applied in the field of data visualization, can solve the problems of uneven distribution of pie chart data, affecting user observation and analysis, affecting the aesthetics of pie chart data, etc., to achieve beautiful and uniform distribution, easy to observe and analysis of the effect
- Summary
- Abstract
- Description
- Claims
- Application Information
AI Technical Summary
Problems solved by technology
Method used
Image

Examples
Embodiment 1
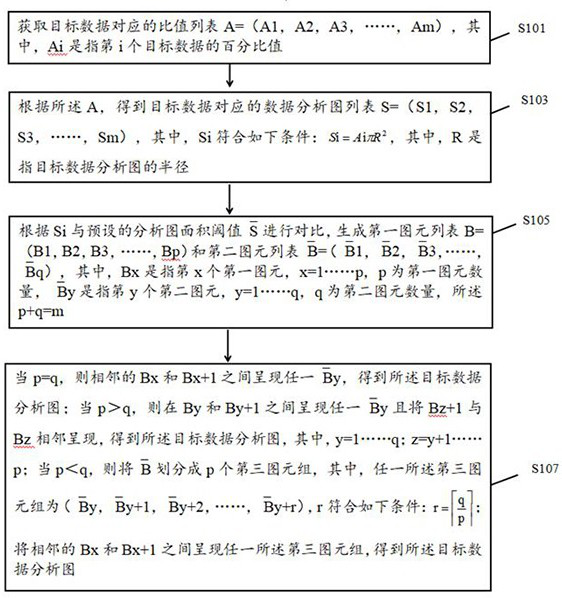
[0024] Such as figure 1 As shown, this embodiment provides a method for displaying a data analysis graph, and the method includes the following steps:
[0025] S101. Obtain the ratio list A=(A1, A2, A3,...,Am) corresponding to the target data, where Ai refers to the percentage value of the i-th target data, i=1...m, m is the number of target data .
[0026] Specifically, the method also includes determining Ai as follows:
[0027] Obtain the target data list C=(C1, C2, C3, ..., Cm), where Ci refers to the i-th target data;
[0028] Ai meets the following conditions:
[0029] .
[0030] Specifically, A1+A2+A3+...+Am=1.
[0031] S103. According to A, obtain the primitive list S=(S1, S2, S3, ..., Sm) of the data analysis diagram corresponding to the target data, and Si meets the following conditions:
[0032] , wherein, R refers to the radius of the target data analysis graph, preferably, the target data analysis graph is a pie chart or other circular analysis graphs. ...
Embodiment 2
[0055] The area of the second embodiment and the first embodiment is that, Meet the following conditions:
[0056] , where K is the parameter value of the analysis graph area threshold and the value range of K conforms to the following:
[0057] When R / W≥ , K ranges from 0.05 to 0.1, preferably, K is 0.1;
[0058] When R / W , K ranges from 0.1 to 0.2, preferably, K is 0.2;
[0059] in, refers to the parameter value threshold, preferably, is 0.25.
[0060] The above method limits the proportion of the target display area according to the target data analysis graph, on the one hand, it can further improve the accuracy of dividing the first graphic element and the second graphic element corresponding to the target data analysis graph; on the other hand On the one hand, it avoids that the target data analysis graph accounts for a large proportion of the target display area, resulting in the division of the first graphic element number is much larger than the second gr...
Embodiment 3
[0064] The area of the third embodiment and the first embodiment lies in presenting any third graph element group between Bx and Bx+1 to obtain the target data analysis diagram, which also includes:
[0065] Any of the third group of primitives Adjust the value of the radius R corresponding to y , the Meet the following conditions:
[0066] .
[0067] Further, K is the parameter value of the analysis graph area threshold and the value range of K conforms to the following:
[0068] When R / W≥ , K ranges from 0.05 to 0.1, preferably, K is 0.1;
[0069] When R / W , K ranges from 0.1 to 0.2, preferably, K is 0.2;
[0070] in, refers to the parameter value threshold, preferably, is 0.25.
[0071] The above method adjusts the radius corresponding to the second graphics entity. On the one hand, when multiple second graphics entities are displayed at the same time, the second graphics entity can be completely presented, which is convenient for users to analyze the dat...
PUM
 Abstract
Description
Claims
Application Information
 - R&D Engineer
- R&D Manager
- IP Professional
- Industry Leading Data Capabilities
- Powerful AI technology
- Patent DNA Extraction
Browse by: Latest US Patents, China's latest patents, Technical Efficacy Thesaurus, Application Domain, Technology Topic, Popular Technical Reports.
© 2024 PatSnap. All rights reserved.Legal|Privacy policy|Modern Slavery Act Transparency Statement|Sitemap|About US| Contact US: help@patsnap.com