
A knowledge map visualization method and system

A knowledge graph and knowledge technology, applied in the field of knowledge graph, can solve problems such as browser incompatibility, and achieve the effect of avoiding node position dislocation, good compatibility and consistent effect

Active Publication Date: 2021-11-26
TIBET UNIVERSITY FOR NATIONALITIES
View PDF0 Cites 0 Cited by
  • Summary
  • Abstract
  • Description
  • Claims
  • Application Information

AI Technical Summary

Problems solved by technology

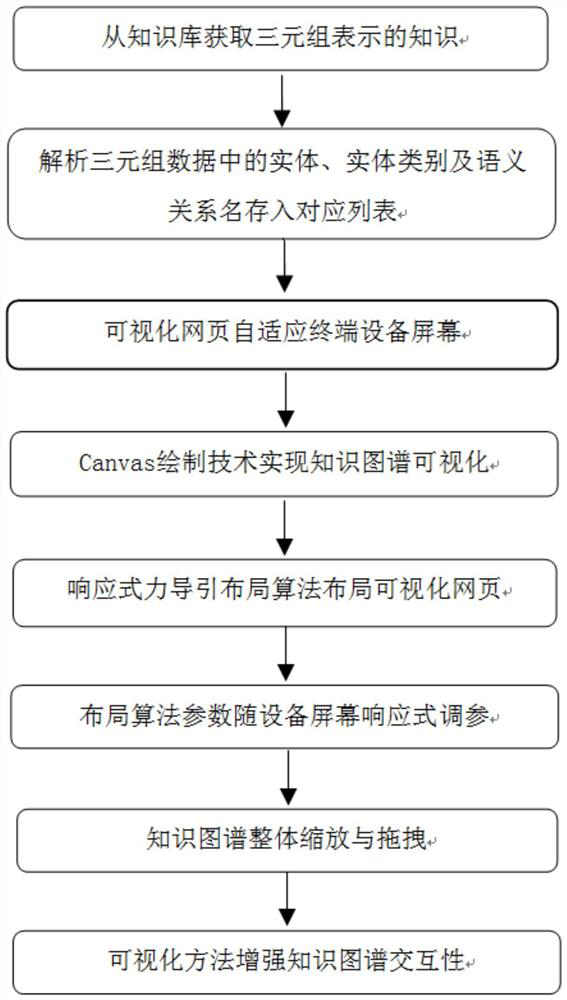
[0005] The purpose of the present invention is to provide a knowledge map visualization method and system, which can solve the problem of browser incompatibility caused by the use of scalar maps, and has the advantages of supporting multi-device screen display, and supporting the overall zooming and dragging of the map

Method used


Image

  • A knowledge map visualization method and system
  • A knowledge map visualization method and system
  • A knowledge map visualization method and system

Examples


Embodiment

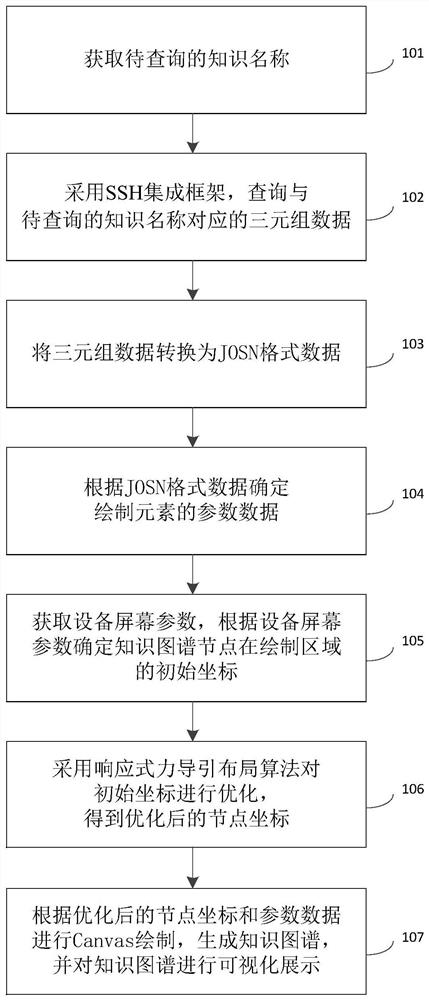
[0116] figure 1 It is a flow chart of the knowledge map visualization method in the embodiment of the present invention, such as figure 1 As shown, a knowledge map visualization method includes:

[0117] Step 101: Obtain the name of the knowledge to be queried.

[0118] Step 102: Use the SSH integration framework to query the triplet data corresponding to the knowledge name to be queried; the triplet data includes entities, entity categories and entity semantic relations.

[0119] Step 103: Convert triplet data into JSON format data.

[0120] Step 103 specifically includes:

[0121] Carry out entity semantic relationship analysis and entity analysis on the triple data respectively, and obtain the parsed entity semantic relationship and the parsed two entity names;

[0122] Determine the entity category to which the two resolved entity names belong according to the parsed entity semantic relationship, and obtain the category to which the entity belongs;

[0123] Store the ...


PUM


Abstract

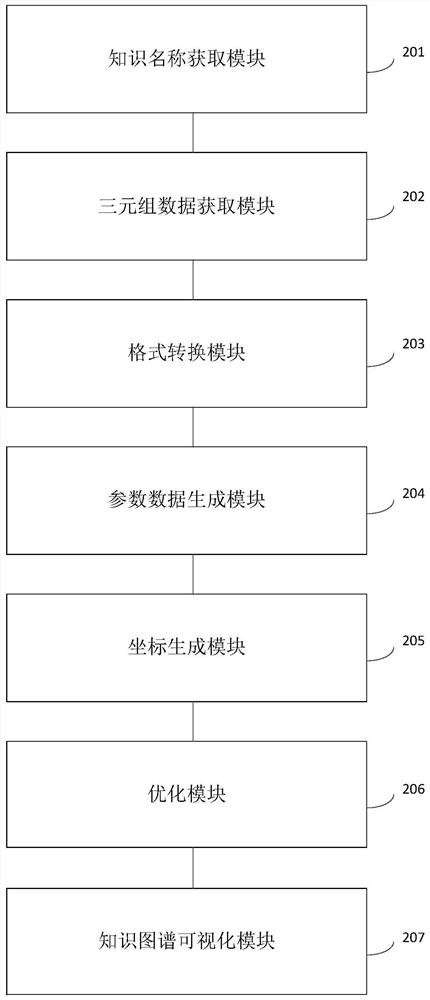
The invention discloses a knowledge graph visualization method and system. The method includes: using the SSH integration framework to query the triplet data corresponding to the knowledge name to be queried; converting the triplet data into JSON format data; determining parameter data of drawing elements according to the JSON format data; obtaining device screen parameters, Determine the initial coordinates of the knowledge map nodes in the drawing area according to the device screen parameters; use the responsive force-guided layout algorithm to optimize the initial coordinates, and obtain the optimized node coordinates; draw the Canvas according to the optimized node coordinates and parameter data, and generate Knowledge map, and visualize the knowledge map. The method and system of the present invention can solve the problem of browser incompatibility caused by the use of scalar graphs, and has the advantages of supporting multi-device screen display, and supporting overall zooming and dragging of graphs.

Description

technical field [0001] The present invention relates to the technical field of knowledge graphs, in particular to a method and system for visualizing knowledge graphs. Background technique [0002] Knowledge graph (Knowledge Graph, KG) is to visually display knowledge and their interrelationships by means of visualization technology, in which entities serve as nodes in the graph, and semantic relationships between entities serve as edges of the graph. The knowledge map breaks data isolation, facilitates machine learning data and knowledge reasoning, thereby discovering deep knowledge and relationships, and providing support for smart search, intelligent question and answer, recommendation, and intelligent decision-making. [0003] At present, the knowledge map visualization technology uses css3 technology to control the layout and style of the scalar map nodes in the map in the web page. However, using a scalar graph as a node of the knowledge graph will lead to browser inc...

Claims


Application Information

Patent Timeline
Patent Type & Authority Patents(China)
IPC IPC(8): G06F16/36G06F16/34G06F16/338G06F40/30
CPCG06F16/338G06F16/34G06F16/367G06F40/30
Inventor 赵尔平王禹皓王伟
Owner TIBET UNIVERSITY FOR NATIONALITIES
Learn More