Application of PDE3 inhibitor and cytokine in combined treatment of tumors
A cytokine and inhibitor technology, applied in the application field of PDE3 inhibitor and cytokine combined treatment of tumors, can solve problems such as hair loss, immunosuppression, vomiting, etc.
- Summary
- Abstract
- Description
- Claims
- Application Information
AI Technical Summary
Problems solved by technology
Method used
Image
Examples
Embodiment 1
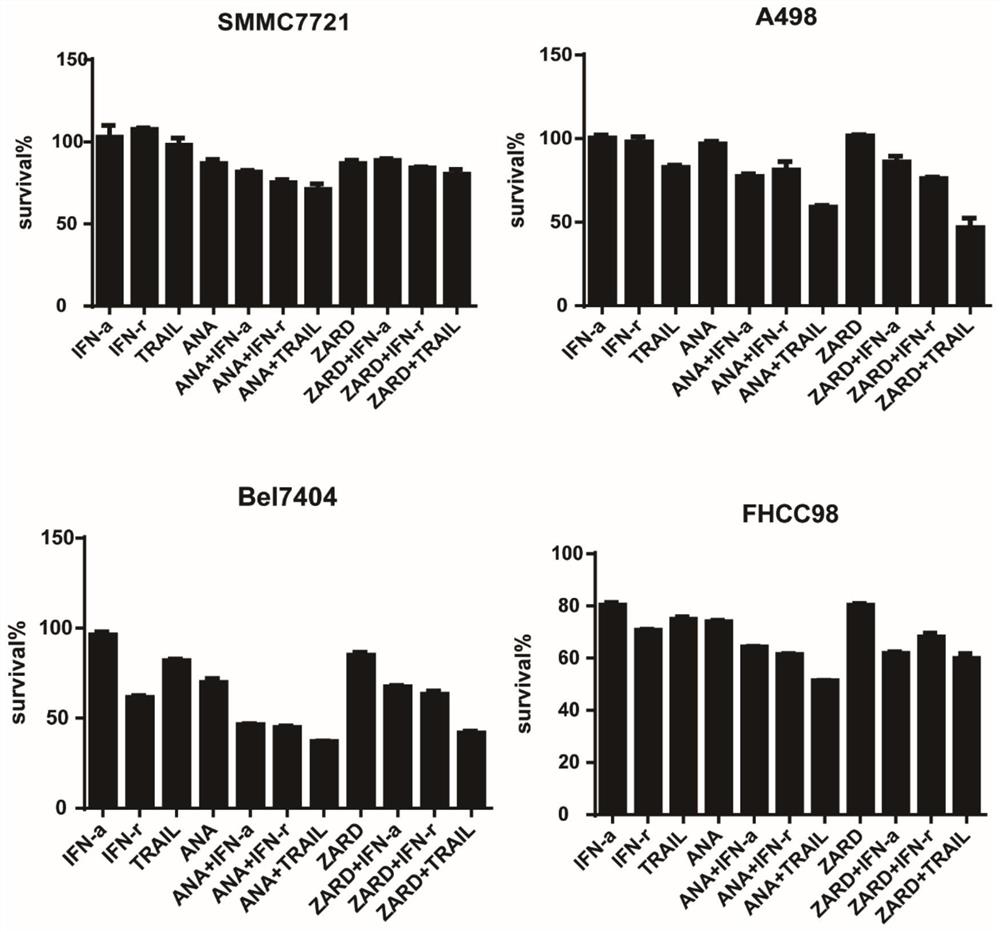
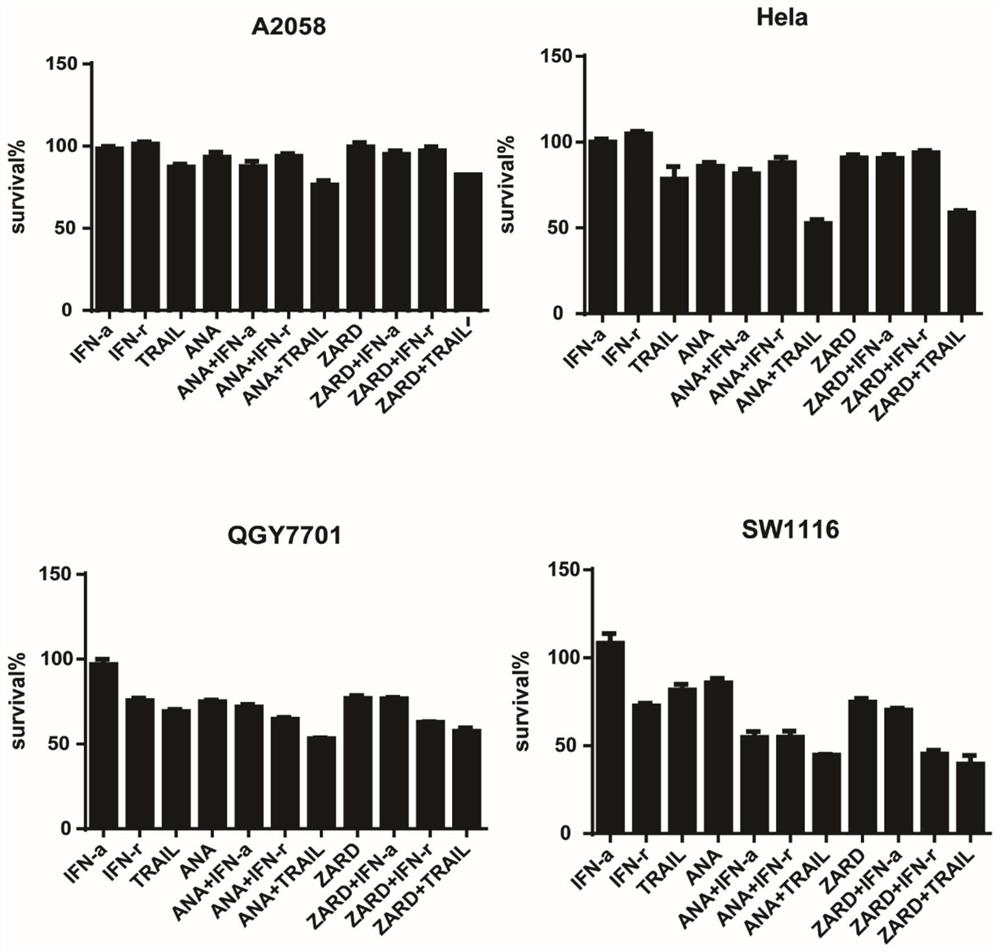
[0186] Cytotoxicity test
[0187] 1. Digest and count the tumor cells in the logarithmic growth phase, inoculate 3000-5000 / well in a 96-well plate with 50ul medium per well, at a constant temperature of 37°C and 5% CO 2 Cells adhered overnight in an incubator.
[0188] 2. After the cells were firmly attached to the wall, 50 ul of the compounds with the drug concentrations shown in Table 1 were added to each well (where ANA represented Anagrelide, and ZARD represented Zardaverine) and incubated for 72 hours.
[0189] 3. After the drug incubation time is over, first observe the response of the cells to the drug (cell number, cell state) under a microscope, and then add 30uL MTT (5mg / ml in PBS) to each well for 3-5 hours.
[0190] 4. After the MTT incubation is completed, go to the sink and throw out the liquid in the 96-well plate (throw out at one time, try to get rid of the liquid in the plate as much as possible, but do not get rid of the blue-purple crystals in the plate), ...
Embodiment 2
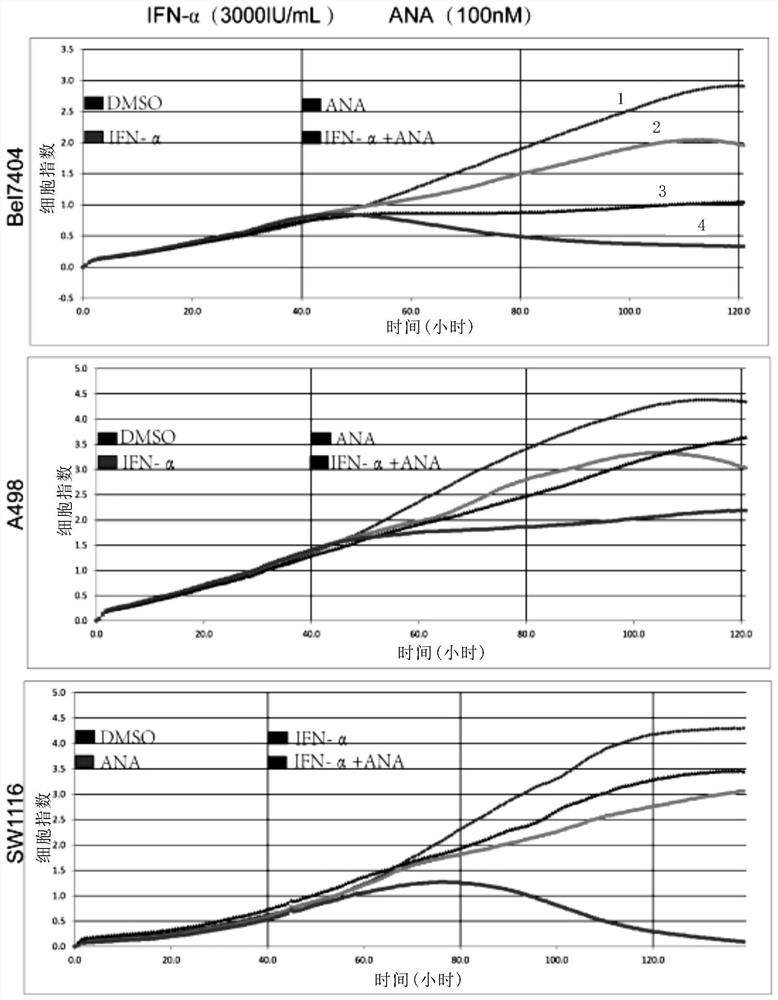
[0204] RTCA experiment
[0205] 1. Add 50ul of the cell culture medium of the cells to be tested in each well of the E-plate, and check the background impedance value
[0206] 2. Add 50ul of culture medium containing 3000-5000 cells to be tested into each well, put it into the detection platform (the detection platform is placed in the cell culture incubator as a whole), and set the program to scan and detect the impedance value every 5 minutes.
[0207] 3. The cells were cultured overnight until the growth curve entered the logarithmic growth phase. Take out the E-plate from the detection table and add 50ul of the compound to be tested to the specified concentration per well (the final concentration of each group is shown in Table 3). After the treatment, put it back into the detection table to detect the cell growth in real time.
[0208] table 3
[0209]
[0210]
[0211] Experimental results
[0212] In the RTCA experiment, the treatment results of each drug group...
Embodiment 3
[0214] The experimental method is basically the same as in Example 2, using TNF-α (10ng / mL), ANA (100nM) and TNF-α (10ng / mL)+ANA (100nM) to process Bel7404, SW1116 cell lines; TNF-α (10ng / mL) mL), ZARD (100nM) and TNF-α (10ng / mL) + ZARD (100nM) to treat Bel7404, SW1116 cell lines.
[0215] Experimental results such as Figure 3A-3B As shown, the results show that ANA, ZARD and tumor necrosis factor TNF-α can play a synergistic effect, and the synergistic anti-tumor effect is significantly better than the single use of PDE3 inhibitor or tumor necrosis factor TNF-α.
PUM
 Abstract
Description
Claims
Application Information
 - R&D Engineer
- R&D Manager
- IP Professional
- Industry Leading Data Capabilities
- Powerful AI technology
- Patent DNA Extraction
Browse by: Latest US Patents, China's latest patents, Technical Efficacy Thesaurus, Application Domain, Technology Topic, Popular Technical Reports.
© 2024 PatSnap. All rights reserved.Legal|Privacy policy|Modern Slavery Act Transparency Statement|Sitemap|About US| Contact US: help@patsnap.com


