Methods of detecting structural variations in genomic regions
A structural variation and genomic technology, applied in the field of bioinformatics, can solve the problems of lack of structural variation detection methods, false positives of structural variation detection software, affecting the application of structural variation detection, etc.
- Summary
- Abstract
- Description
- Claims
- Application Information
AI Technical Summary
Problems solved by technology
Method used
Image
Examples
Embodiment 1
[0133] Example 1. Structural variation detection method
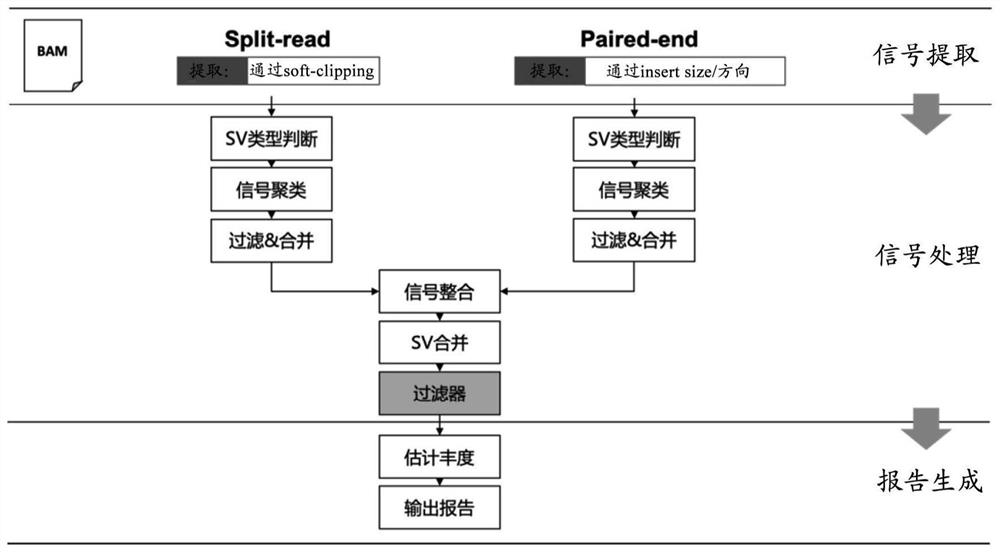
[0134] In the examples of the present disclosure, the following method (markSV method) was used to detect structural variation in genomic regions.
[0135] 1. Sequence comparison file generation: After the samples to be tested undergo library preparation, they are sequenced on the Illumina sequencing platform to generate FASTQ files. After performing quality control on the FASTQ files, use the comparison software BWA-MEM to compare the FASTQ files with the human reference genome (hg19 / b37) and generate a SAM file. After the SAM file is converted into a BAM file with samtools software, the BAM file is used as the input file for subsequent detection.
[0136] 2. Insert length outlier calculation: Read the read length in the BAM file to estimate the parameters of the insert length distribution and the threshold of outliers. If the BAM file contains more than 1 million read lengths, 1 million reads are randomly selected...
Embodiment 2
[0159] Example 2. Simulation data performance confirmation
[0160] The simulated data covers 79 common fusion genes, a total of 11.81M regions. Simulate various SV types, and a total of 20,000 cases including SVs ranging in size from 50bp to 1,000,000bp. The sequencing depth was set at 200x, and the SV abundance was set at 50%. The method described in Example 1 (markSV method) was compared with other three mainstream SV analysis software. The three SV analysis software are Delly v0.7.9, Lumpy v0.2.13, and Manta v1.4.0. All analyzes were performed with default parameters. Keep the results of FILTER as PASS in the VCF file, where Lumpy does not set FILTER, keep all the results. The analysis results are as follows:
[0161] Table 1. Sensitivity and precision of markSV on 20,000 cases of broad-spectrum simulated data
[0162]
[0163] Table 2. Sensitivity and precision of four SV analysis software in 20,000 cases of broad-spectrum simulation data
[0164] SV...
Embodiment 3
[0166] Embodiment 3. Standard product data
[0167] The standard product data is prepared by serial dilution of HD-C670 cell line mixed samples containing two fusions (EML4-ALK, CD74-ROS1), and the diluted abundance is calibrated by the ddPCR platform. In order to ensure reproducibility, each gradient was repeated several times under different machine batches, different reagent batches, different experimental operators, etc., with a total of 58 samples. The result is as follows:
[0168] Table 3. Summary of Standards Data
[0169]
[0170] The method described in Example 1 (markSV method) was compared with other three mainstream SV analysis software. The three SV analysis software are Delly v0.7.9, Lumpy v0.2.13, and Manta v1.4.0. All were analyzed with the default analysis parameters. Keep the results of FILTER as PASS in the VCF file, where Lumpy does not set FILTER, keep all the results. The analysis results are as follows:
[0171] Table 4. Sensitivity and preci...
PUM
 Abstract
Description
Claims
Application Information
 - Generate Ideas
- Intellectual Property
- Life Sciences
- Materials
- Tech Scout
- Unparalleled Data Quality
- Higher Quality Content
- 60% Fewer Hallucinations
Browse by: Latest US Patents, China's latest patents, Technical Efficacy Thesaurus, Application Domain, Technology Topic, Popular Technical Reports.
© 2025 PatSnap. All rights reserved.Legal|Privacy policy|Modern Slavery Act Transparency Statement|Sitemap|About US| Contact US: help@patsnap.com


