A method for establishing a nomogram model for predicting the curative effect of tumor immunotherapy
A technology for immunotherapy and establishment of methods, applied in the field of biomedicine, can solve the problem of unknown prognostic effect of important mutant genes, achieve good survival benefits, reduce errors in judgment, and be easy to popularize and apply.
- Summary
- Abstract
- Description
- Claims
- Application Information
AI Technical Summary
Problems solved by technology
Method used
Image
Examples
Embodiment 1
[0038] Example 1 Construction of a prediction model for the curative effect of non-small cell lung cancer immunotherapy
[0039] 1137 patients with NSCLC receiving advanced second-line or third-line therapy (full cohort), including 289 patients (POPLAR cohort) from the POPLAR phase II trial (NCT01903993) and 850 patients (OAK cohort) from the OAK phase III trial (NCT02008227) , according to the PRISMA-IPD and TRIPOD guidelines, patients were randomly assigned to atezolizumab group (POPLAR, N=144; OAK, N=425) and docetaxel group (POPLAR, N=143; OAK, N =425).
[0040] (1) Mutation gene screening for hematological tumors
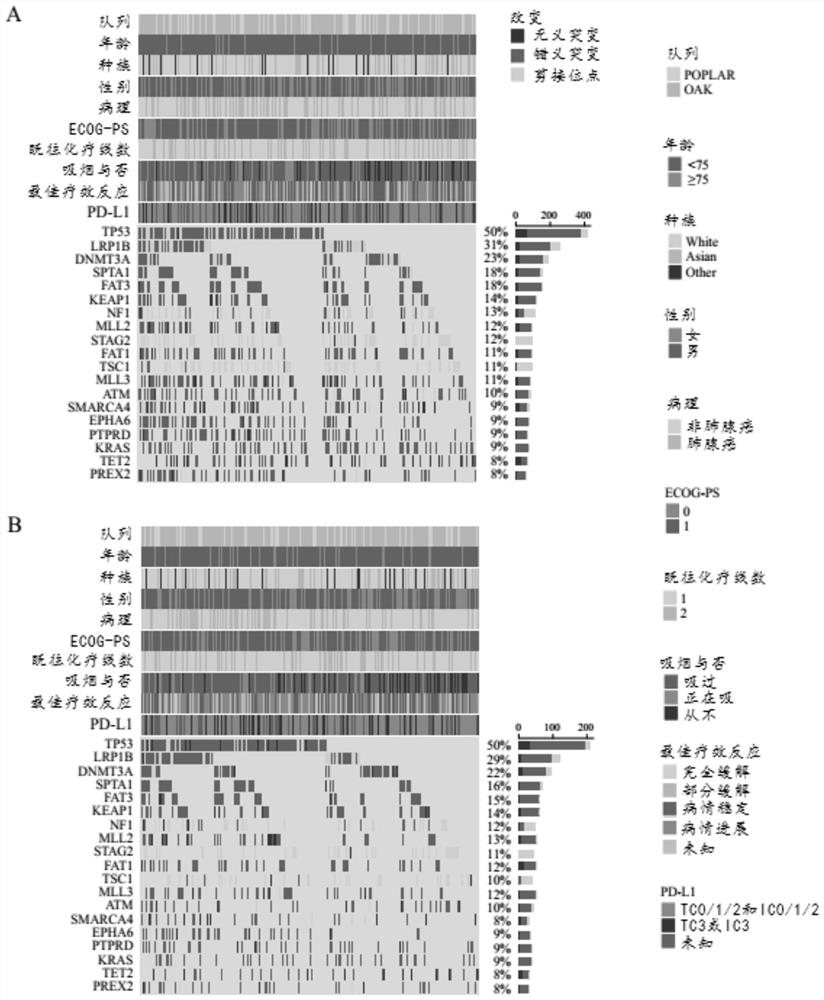
[0041] The blood of all test patients was drawn, and the genetic status was detected by FDA-approved FoundationOneCDx NGS. In the whole cohort of patients, TP53 (50%), LRP1B (31%), DNMT3A (23%), SPTA1 (18%), FAT3 (18%), KEAP1 (14%), NF1 (13%), MLL2 (12%), STAG2 (12%), FAT1 (11%), TSC1 (11%), MLL3 (10%), SMARCA4 (9%) %), EPHA6 (9%), PTPRD (9%), KRAS (9%), TET...
Embodiment 2
[0055] Verification and comparison of the model of embodiment 2
[0056] (1) Verification and comparison of the Nomogram A model
[0057] The OAK cohort (HR=0.37, 95% CI: 0.28-0.49, P Figure 6 A), POPLAR cohort (HR=0.37, 95% CI: 0.18-0.66, P Figure 6 B) and the whole cohort (HR=0.42, 95% CI: 0.33-0.54, P Figure 6 C) Patients are divided into high-risk group and low-risk group.
[0058] The predictive power of the Nomogram A model was evaluated graphically and quantitatively by the calibration curve index. The cohort (C index 0.669) and the whole cohort (C index 0.646) had good predictive power.
[0059] ROC curve analysis showed that the Nomogram A model predicted the 1-year, 2-year and 3-year OS of patients in the atezolizumab group better than the OAK cohort (AUC=0.694, 0.721, 0.733), POPLAR cohort (AUC=0.693, 0.726 , 0.711) and the whole cohort (AUC=0.684, 0.696, 0.714) all had good prediction performance. Using DCA curve analysis found (such as Figure 7 A), Nomogram A...
PUM
 Abstract
Description
Claims
Application Information
 - R&D
- Intellectual Property
- Life Sciences
- Materials
- Tech Scout
- Unparalleled Data Quality
- Higher Quality Content
- 60% Fewer Hallucinations
Browse by: Latest US Patents, China's latest patents, Technical Efficacy Thesaurus, Application Domain, Technology Topic, Popular Technical Reports.
© 2025 PatSnap. All rights reserved.Legal|Privacy policy|Modern Slavery Act Transparency Statement|Sitemap|About US| Contact US: help@patsnap.com


