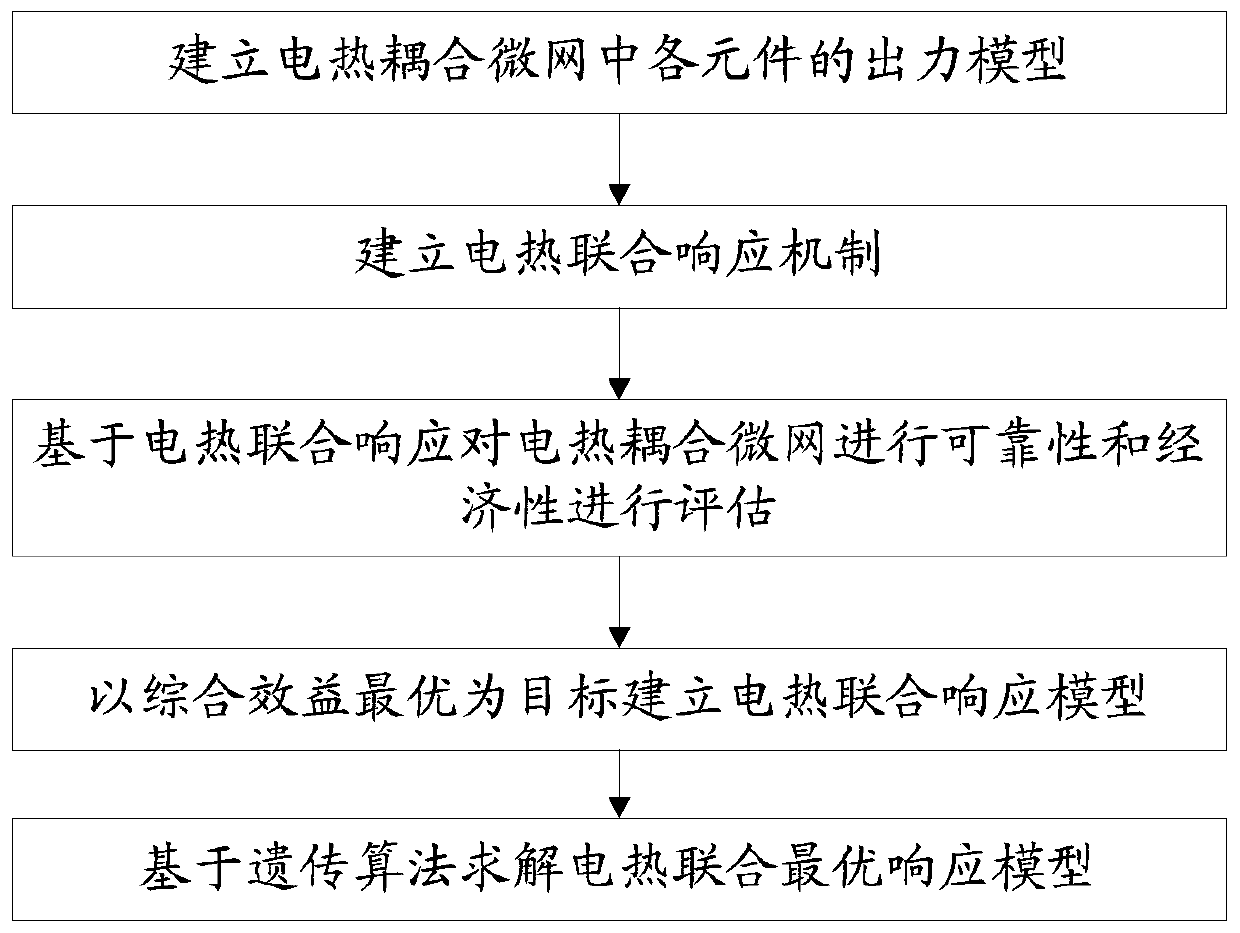
Method for establishing optimal response model of electro-thermal coupling microgrid by comprehensively considering reliability and economy
An electrothermal coupling and response model technology, applied in data processing applications, electrical digital data processing, design optimization/simulation, etc.
- Summary
- Abstract
- Description
- Claims
- Application Information
AI Technical Summary
Problems solved by technology
Method used
Image
Examples
Embodiment 1
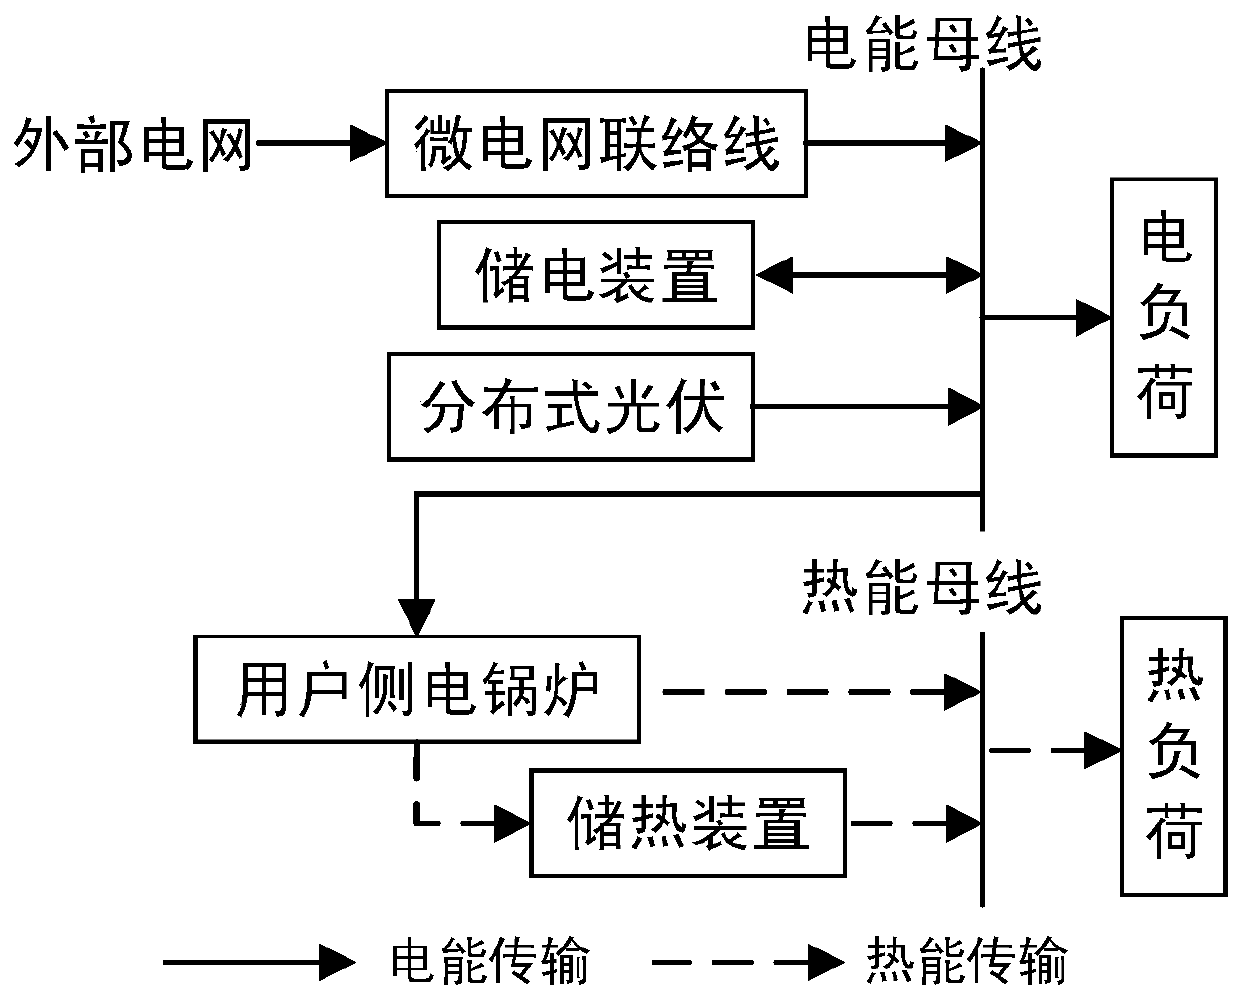
[0097] In this embodiment, the step S1 includes the following specific content. Considering the timing characteristics of the microgrid, the output model of each main component is as follows:
[0098] S11. Establishing a photovoltaic output model; statistical historical data to obtain the annual light intensity sequence, and combining the relationship between light intensity and photovoltaic output to determine the annual photovoltaic output model;
[0099] S12. Establish the power and heat load output model; the real-time electric load can be obtained through typical year-week, week-day and day-hour curves, and the calculation formula is,
[0100] L t = L p ×P w ×P d ×P h (t)
[0101] Among them, L p is the annual peak load, P w is the annual-weekly load percentage coefficient corresponding to the tth hour, P d is the corresponding weekly-daily load percentage coefficient, P h (t) is the corresponding daily-hour load percentage coefficient;
[0102] The annual time-...
Embodiment 2
[0113] In this embodiment, the step S2 includes the following specific content,
[0114] S21. Establish an electricity-heating joint response mechanism based on electricity prices; under the peak-valley electricity price, users will automatically adjust their own electricity consumption behavior, and transfer part of the electricity consumption from peak hours to valley hours to reduce electricity costs. The formula for calculating the change in electricity consumption is:
[0115]
[0116] Among them, Q on , Q mid with Q off Respectively represent the original power consumption during the peak, flat and valley periods, ΔQ on , ΔQ mid and ΔQ off Respectively represent the amount of change in electric load during the peak, flat and valley periods, P on ,P mid with P off respectively represent the electricity price during the peak, flat and valley periods, ΔP on , ΔP mid and ΔP off Represent the electricity price changes in the three time periods, ε is the electric...
Embodiment 3
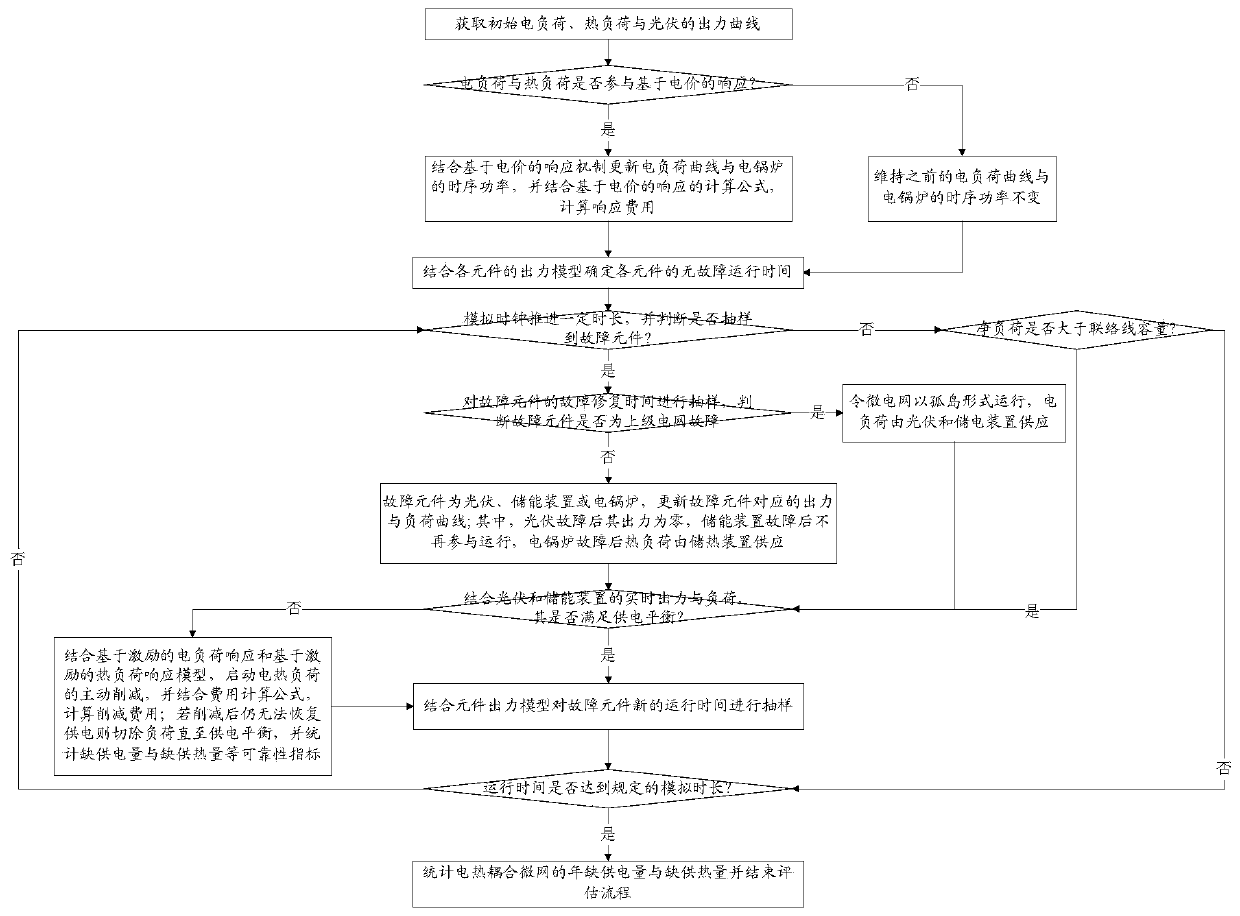
[0135] Such as image 3 As shown, in this embodiment, the reliability and economy of the electrothermal coupling microgrid are evaluated based on the combined electrothermal response. Combined with the timing characteristics of the components and the demand response mechanism, Monte Carlo simulation is used to evaluate the reliability after considering the combined response of electricity and heat, and calculate the economic representative of the response. Focusing on the influence of faults on components such as photovoltaics, power storage, heat storage, electric boilers, and upper-level power grids, the fault-free working time and fault repair time of each component obey the exponential distribution of the equipment failure rate and repair rate as parameters.
[0136] Reliability indicators are represented by the shortage of power supply and the shortage of heat supply, and the demand response costs are calculated respectively. In the context of rapid increase in electrica...
PUM
 Abstract
Description
Claims
Application Information
 - R&D
- Intellectual Property
- Life Sciences
- Materials
- Tech Scout
- Unparalleled Data Quality
- Higher Quality Content
- 60% Fewer Hallucinations
Browse by: Latest US Patents, China's latest patents, Technical Efficacy Thesaurus, Application Domain, Technology Topic, Popular Technical Reports.
© 2025 PatSnap. All rights reserved.Legal|Privacy policy|Modern Slavery Act Transparency Statement|Sitemap|About US| Contact US: help@patsnap.com


