Big data visual interface configuration method and device, server and storage medium
A configuration method and big data technology, applied in the direction of electrical digital data processing, instrumentation, model-driven code, etc., can solve the problems of spending a lot of time to implement and spend a lot of time, and achieve the effect of shortening the configuration time and improving work efficiency
- Summary
- Abstract
- Description
- Claims
- Application Information
AI Technical Summary
Problems solved by technology
Method used
Image
Examples
Embodiment 1
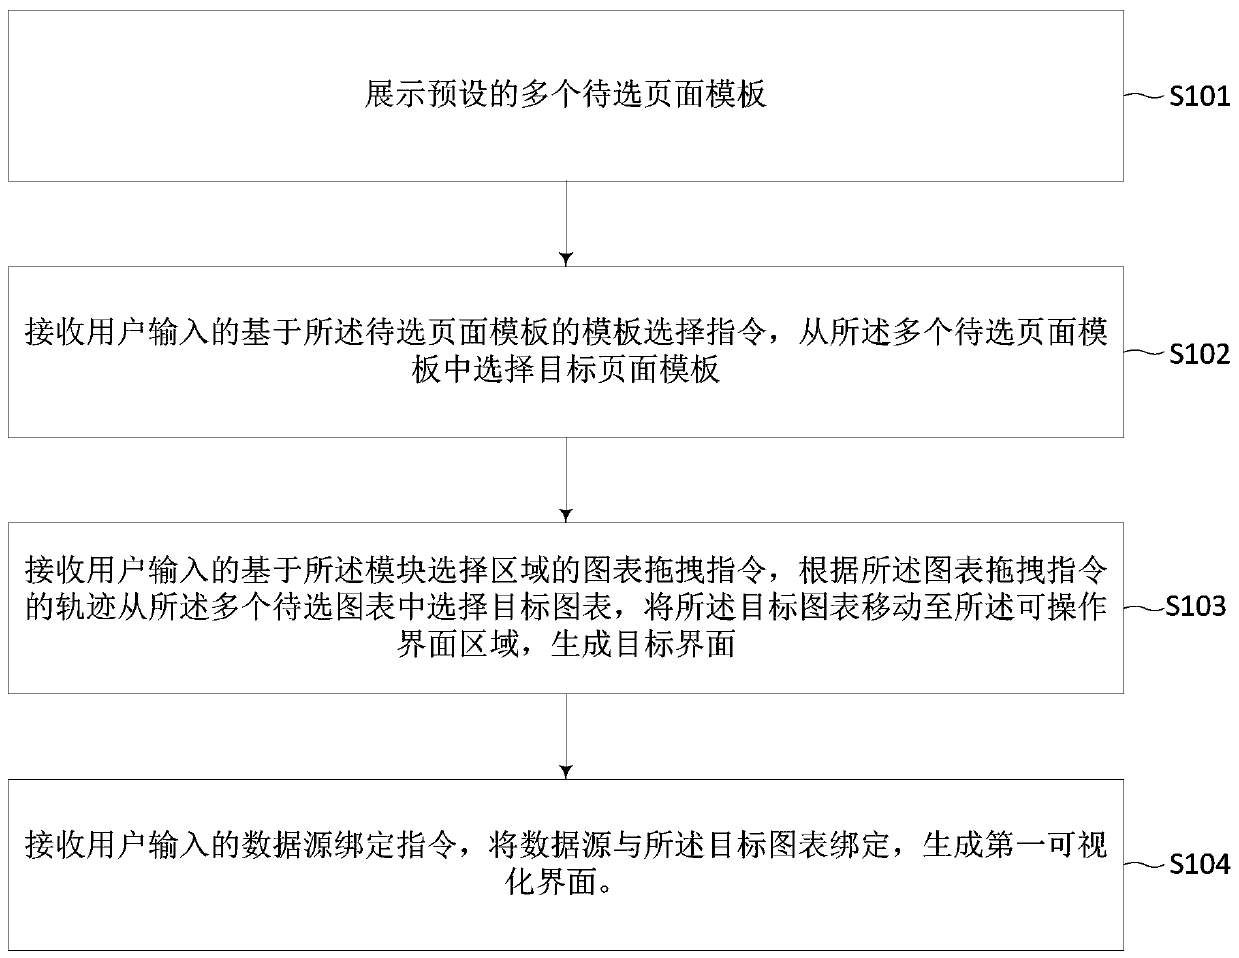
[0054] Such as figure 1 It is a flow chart of the configuration method of the big data visualization interface in Embodiment 1 of the present invention. In this embodiment, by making the template of the page to be selected in advance and modularizing the charts in the page, it is convenient for software engineers to configure the required charts according to needs, saving interface production time.
[0055] The first step of this embodiment is as follows:
[0056] S101. Displaying a plurality of preset page templates to be selected;
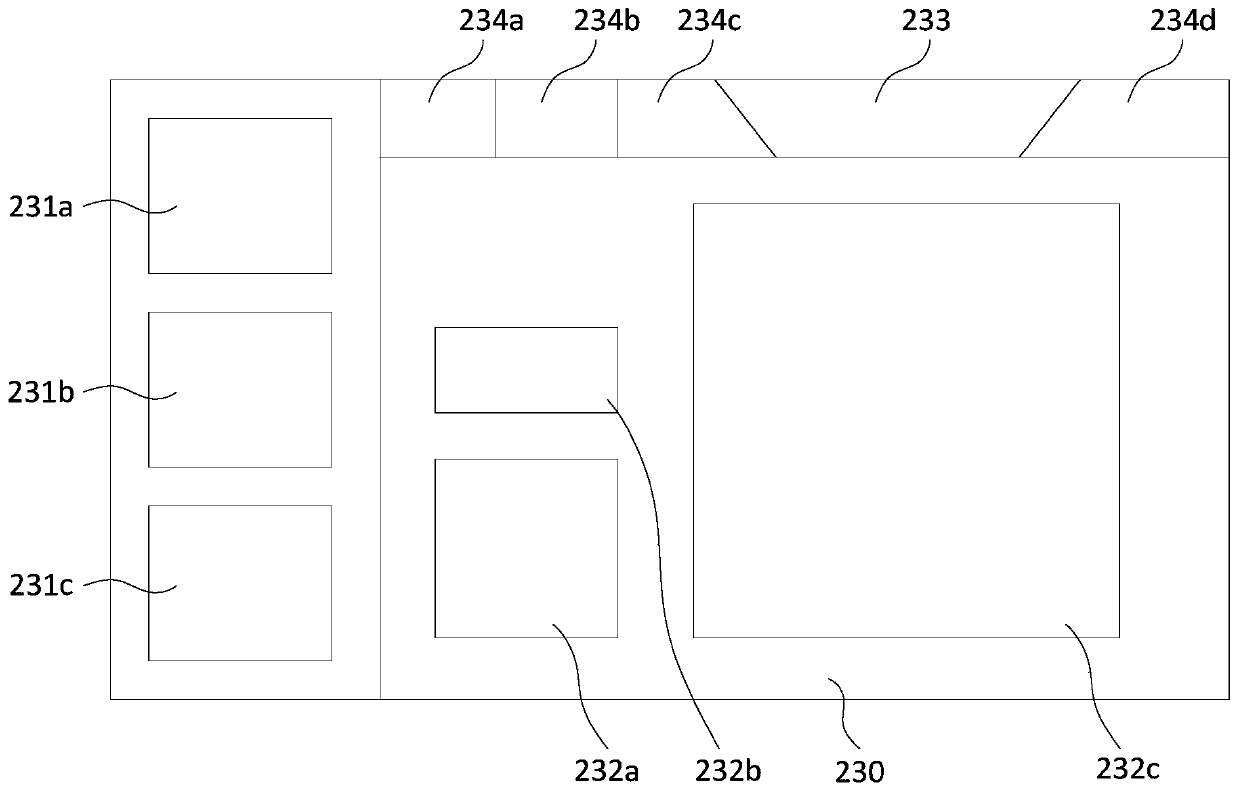
[0057]In this step, the page template to be selected includes a module selection area and an interface display area, the interface display area includes a fixed interface area and one or more operable interface areas, and the module selection area includes a plurality of charts to be selected.
[0058] Among them, the page template to be selected defines the style characteristics of the visual interface. Specifically, the fixed interface area i...
Embodiment 2
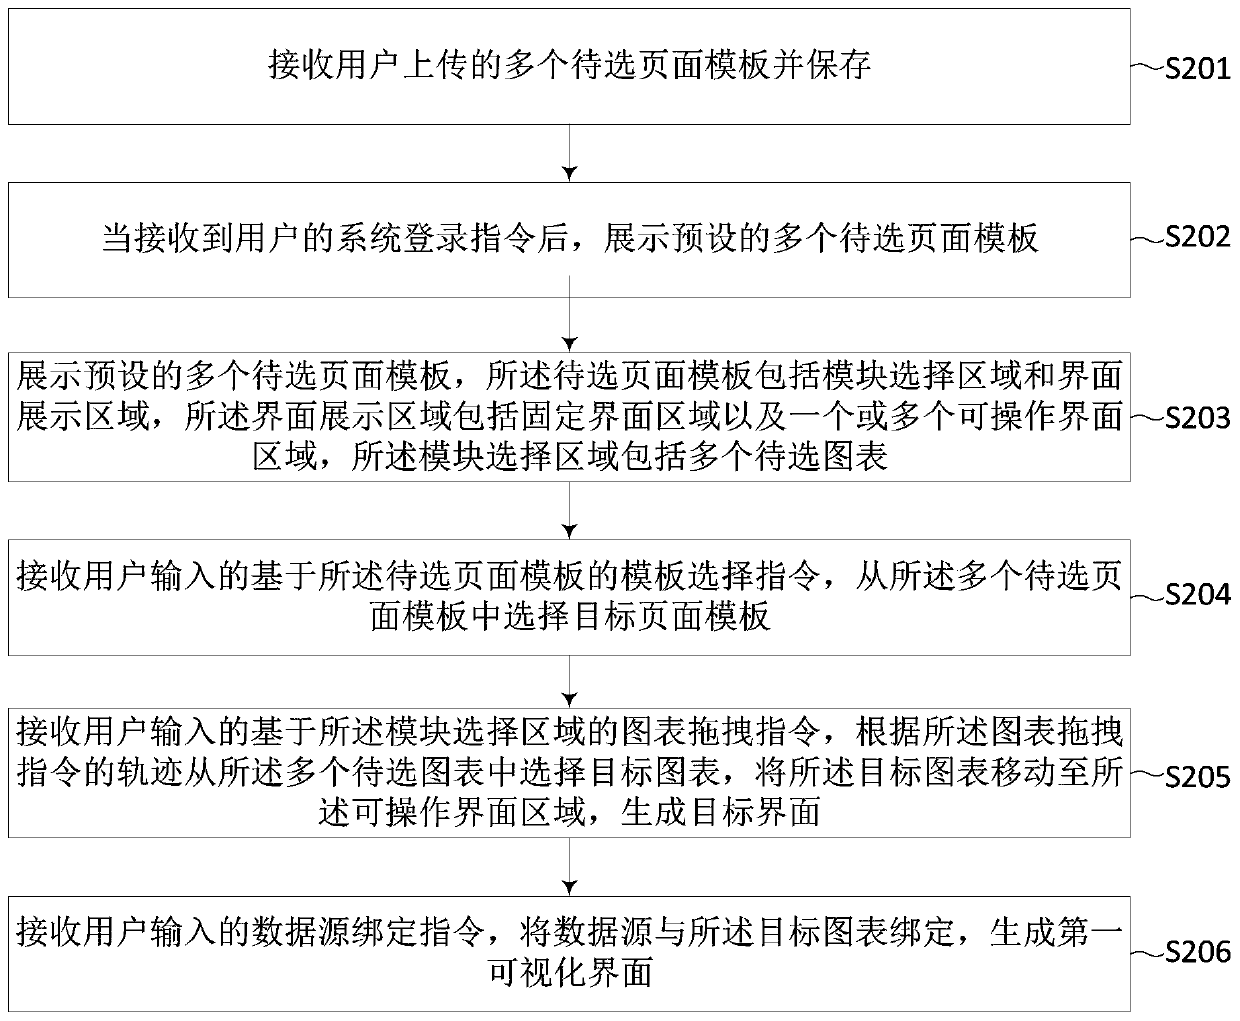
[0068] figure 2 The flow chart of the configuration method of the big data visualization interface provided by Embodiment 2 of the present invention. On the basis of Embodiment 1 above, this embodiment preferably adds a step of how to trigger the display of the page template to be selected. The specific steps are as follows:
[0069] S201. Receive and save multiple page templates to be selected uploaded by the user;
[0070] Before uploading the page template to be selected, the user needs to carry out the production process: the artist designs a variety of plane patterns of the page template to be selected, and the plane pattern includes the logo, background, edge, shading, separator, etc. of the fixed interface area. The page template has multiple layouts, and the layout refers to the size and arrangement of the module selection area and the interface display area on the page template to be selected. This step also marks the layout of different areas of each page template....
Embodiment 3
[0085] Such as Figure 5 Shown is a flow chart of a method for configuring a big data visualization interface provided by Embodiment 3 of the present invention. This embodiment adds the steps of judging the generated visualization interface through user instructions and modifying the visualization interface, which is convenient for users Modify the visual interface.
[0086] Specific steps are as follows:
[0087] S301. Display multiple preset page templates to be selected. The page templates to be selected include a module selection area and an interface display area. The interface display area includes a fixed interface area and one or more operable interface areas. The module selection area includes multiple Select the chart;
[0088] S302. Receive a template selection instruction based on the page template to be selected input by the user, and select a target page template from multiple page templates to be selected;
[0089] S303. Allocate the first workspace for the t...
PUM
 Abstract
Description
Claims
Application Information
 - R&D
- Intellectual Property
- Life Sciences
- Materials
- Tech Scout
- Unparalleled Data Quality
- Higher Quality Content
- 60% Fewer Hallucinations
Browse by: Latest US Patents, China's latest patents, Technical Efficacy Thesaurus, Application Domain, Technology Topic, Popular Technical Reports.
© 2025 PatSnap. All rights reserved.Legal|Privacy policy|Modern Slavery Act Transparency Statement|Sitemap|About US| Contact US: help@patsnap.com


