Power distribution network current situation evaluation and diagnosis method based on layered radar map method
A diagnostic method and distribution network technology, applied in the direction of instruments, data processing applications, resources, etc., can solve the problem that the diagnostic results are not visualized, and achieve the effect of intuitive evaluation and diagnosis
- Summary
- Abstract
- Description
- Claims
- Application Information
AI Technical Summary
Problems solved by technology
Method used
Image

Examples
Embodiment 1
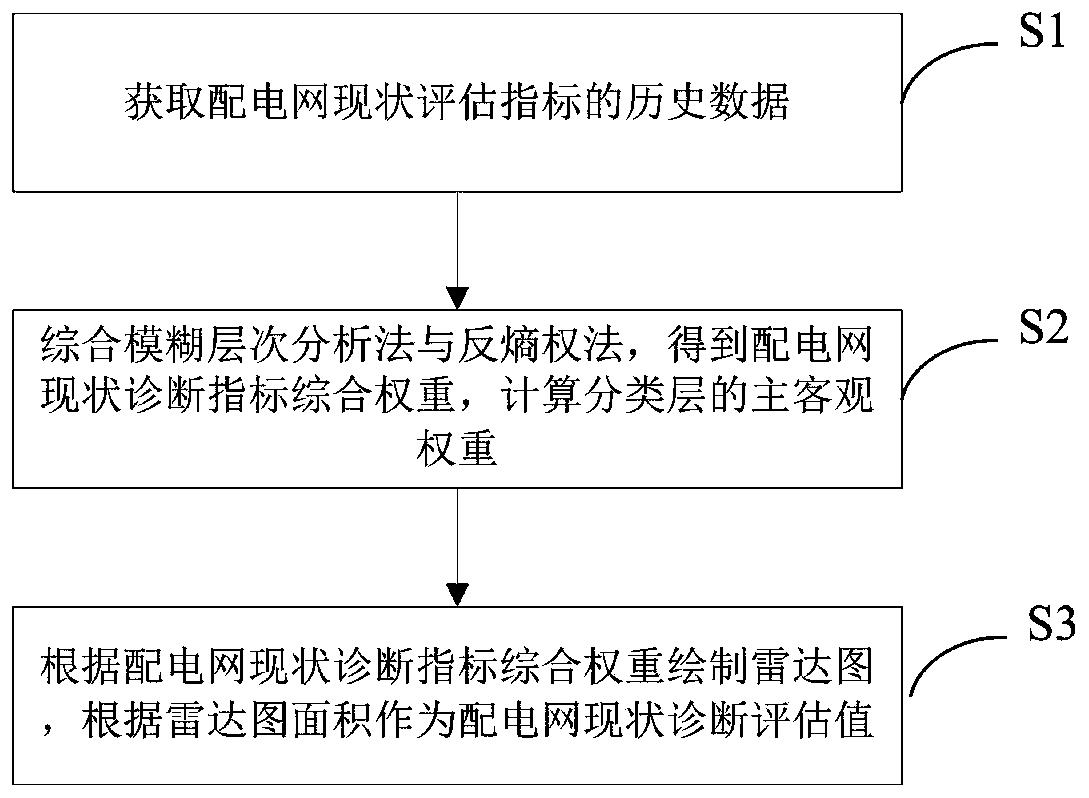
[0044] Such as figure 1 As shown, the distribution network status assessment and diagnosis method based on the layered radar map method includes the following steps:
[0045] S1. Obtain historical data of distribution network status evaluation indicators.
[0046] S2. Combining the fuzzy analytic hierarchy process and the anti-entropy weight method to obtain the comprehensive weight of the diagnostic indicators of the current situation of the distribution network, and calculate the subjective and objective weights of the classification layer.
[0047] S3. Draw a radar chart according to the comprehensive weight of the distribution network status diagnosis index, and use the area of the radar chart as the distribution network status diagnosis evaluation value.
Embodiment 2
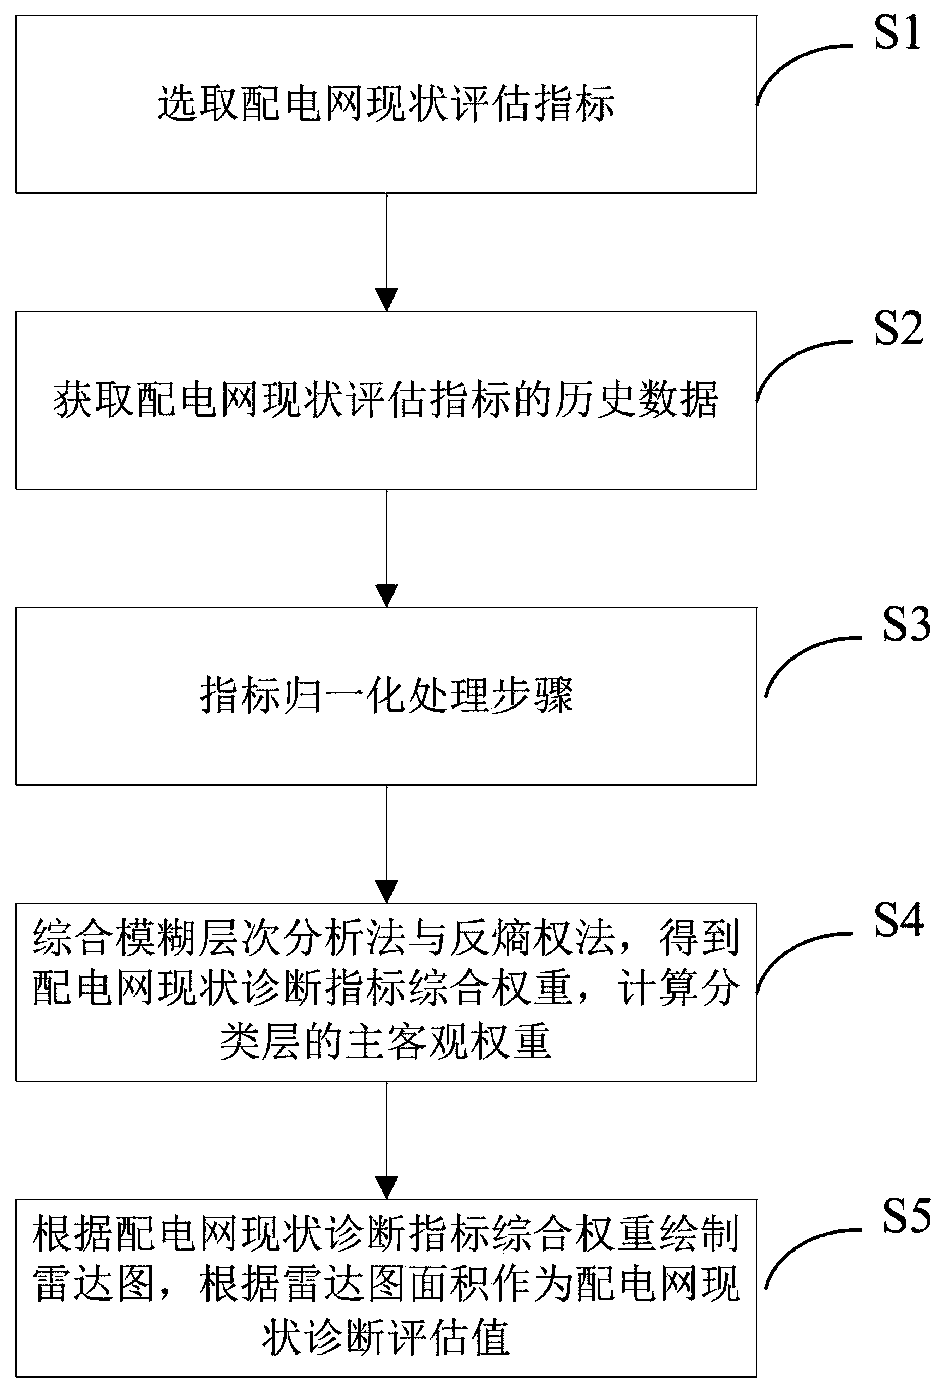
[0049] Such as figure 2 Therefore, the distribution network status assessment and diagnosis method based on the layered radar map method includes the following steps:
[0050] S1. Select the evaluation index of the distribution network status.
[0051] When diagnosing and evaluating the status quo of the distribution network, it is necessary to select as comprehensive indicators as possible, so as to build a comprehensive and reasonable indicator system. When constructing the index system, it is required to ensure the comprehensiveness of the coverage of the index on the one hand, and to reflect the current level of the distribution network as completely as possible; Distribution network indicators. The distribution network status evaluation indicators in this embodiment include power supply capacity indicators, grid structure indicators, operation management indicators and equipment level indicators, as shown in Table 1.
[0052]
[0053]
[0054] Table 1
[0055] ...
Embodiment example
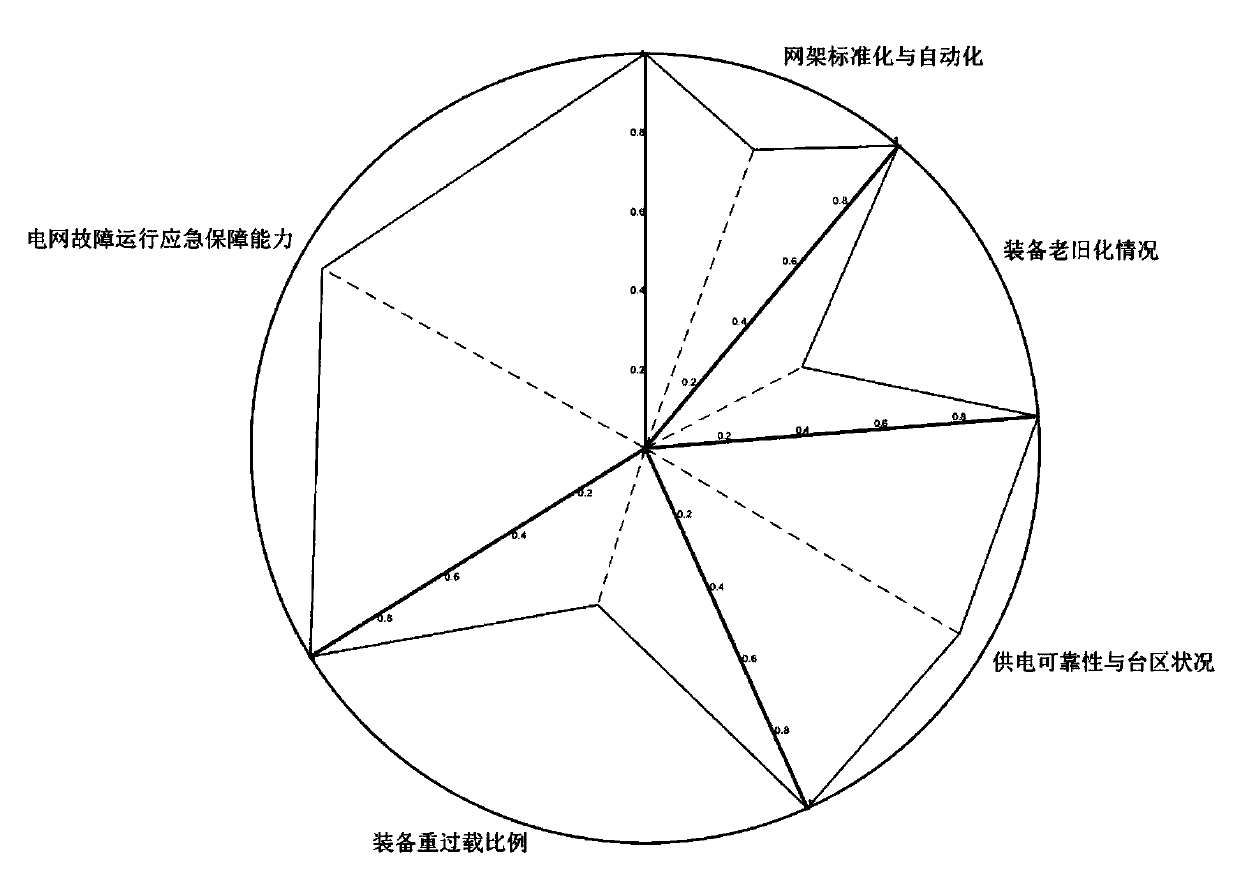
[0091] When the present invention constructs the index system, it is required to ensure the comprehensiveness of the index coverage on the one hand, and to reflect the current level of the distribution network as completely as possible; Level distribution network indicators. As shown in Table 1. The present invention selects the relevant indicators in the A region for diagnosis and evaluation analysis, and obtains the historical data statistics of the distribution network diagnosis and evaluation related indicators according to the distribution network related historical year data collection in the A region, as shown in Table 2:
[0092] Table 2 Relevant index data of distribution network in region A
[0093]
[0094]
[0095] According to the comprehensive fuzzy analytic hierarchy process and anti-entropy weight method of the present invention, the comprehensive weight of the diagnosis index of the current situation of the distribution network in region A is obtained, ...
PUM
 Abstract
Description
Claims
Application Information
 - R&D
- Intellectual Property
- Life Sciences
- Materials
- Tech Scout
- Unparalleled Data Quality
- Higher Quality Content
- 60% Fewer Hallucinations
Browse by: Latest US Patents, China's latest patents, Technical Efficacy Thesaurus, Application Domain, Technology Topic, Popular Technical Reports.
© 2025 PatSnap. All rights reserved.Legal|Privacy policy|Modern Slavery Act Transparency Statement|Sitemap|About US| Contact US: help@patsnap.com