Intelligent water treatment water body pollutant digestion prediction method
A technology for water pollutants and prediction methods, which is applied in the field of smart water pollutants digestion and prediction, can solve the problems of far-flung pollutant diffusion and the pollution prediction method staying in the theoretical stage, etc., to achieve the effect of convenient pollution reduction treatment.
- Summary
- Abstract
- Description
- Claims
- Application Information
AI Technical Summary
Problems solved by technology
Method used
Image
Examples
Embodiment 1
[0027] A smart water service water body pollutant digestion prediction method includes the following steps:
[0028] S1. Depending on the situation, divide the water body to be tested into several sections; it is convenient for the staff to know in time whether there is pollution in the water body of the corresponding section;
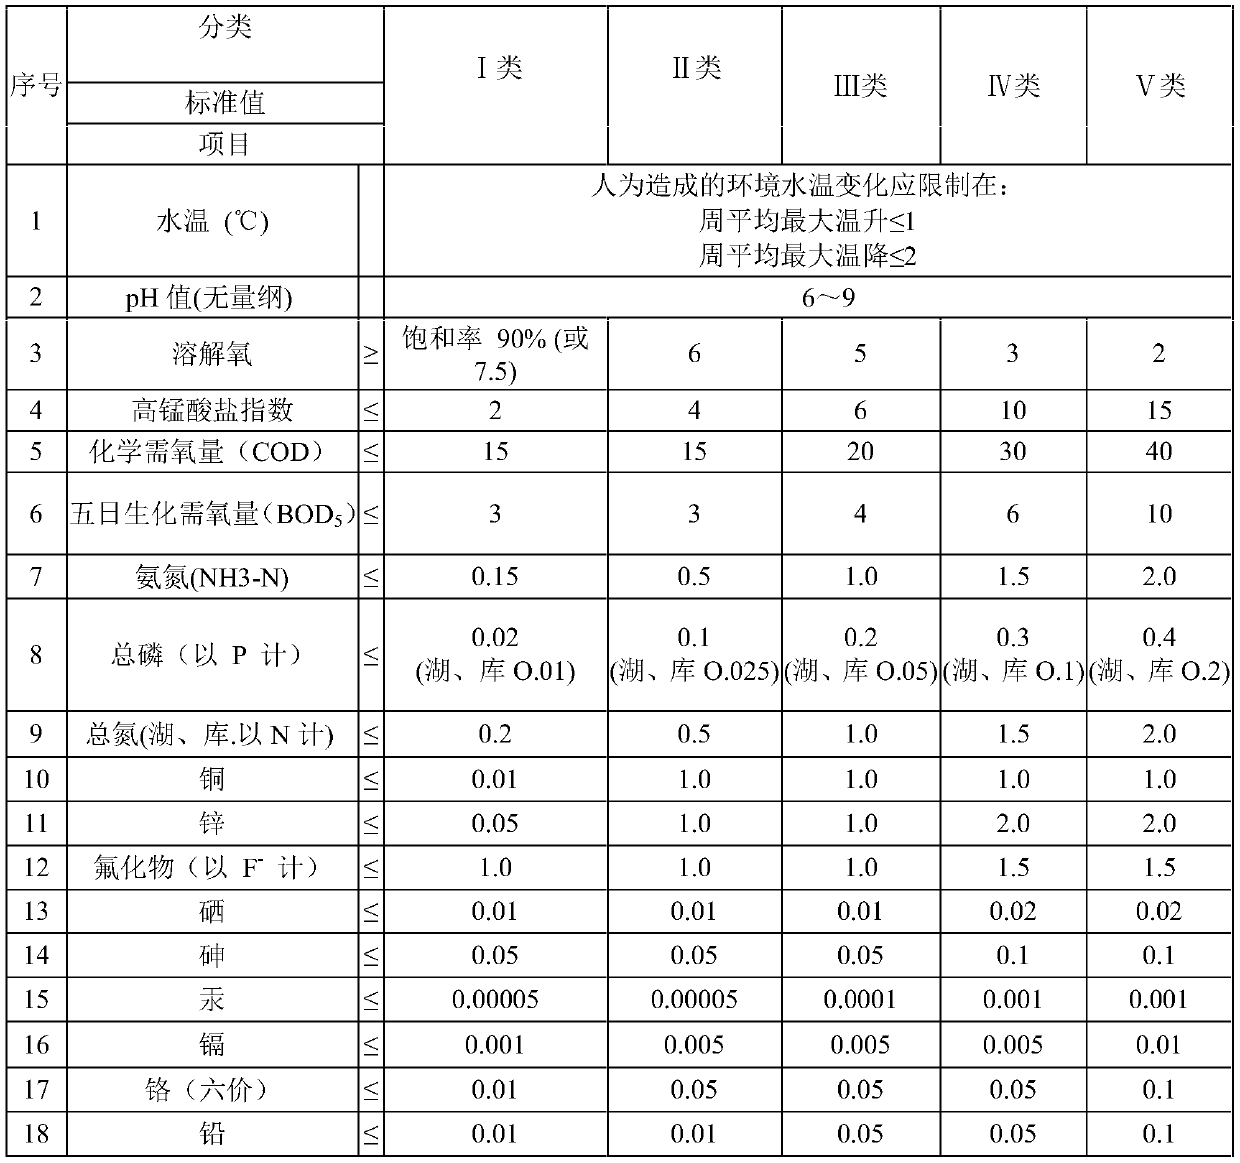
[0029] S2. Set up a detection station on each section of water body; detection devices for detecting the content and concentration of various substances are installed in the detection station (refer to Table 1 for the substances that need to be detected);
[0030] S3. The detection station transmits the detected data of each section of water body to the background terminal through wireless transmission; the detected data is displayed on the display screen;
[0031] S4. According to the data fed back to the background terminal, calculate the specific predicted pollution concentration value of the corresponding segmented water body every 1-2 hours.
[0...
Embodiment 2
[0043] Step S4 includes the following steps:
[0044] S421. Determine whether there is a pollution source according to the pollution standard value (Table 1), and extract the real-time detection data of a section of the polluted water body (generally, the extracted data is the data with the largest value, because the highest concentration is the most seriously polluted place) ;
[0045] S422. Arranging the data obtained above on the background terminal and its corresponding map; using the display screen to display it;
[0046]S423. Take the above water body as a new pollution source, and take the flow velocity, flow rate, water depth and section width of the water body as the input of the hydrodynamic model, and the output of the hydrodynamic model is the pollution value of each other water body from top to bottom, the pollution value For the predicted pollution concentration value. The calculated pollution value should be gradually decreasing from top to bottom. When the po...
PUM
 Abstract
Description
Claims
Application Information
 - R&D
- Intellectual Property
- Life Sciences
- Materials
- Tech Scout
- Unparalleled Data Quality
- Higher Quality Content
- 60% Fewer Hallucinations
Browse by: Latest US Patents, China's latest patents, Technical Efficacy Thesaurus, Application Domain, Technology Topic, Popular Technical Reports.
© 2025 PatSnap. All rights reserved.Legal|Privacy policy|Modern Slavery Act Transparency Statement|Sitemap|About US| Contact US: help@patsnap.com


