
A Passenger Flow Prediction Method for the Highest Section of a Bus Line

A technology of bus lines and forecasting methods, applied in forecasting, genetic rules, data processing applications, etc., can solve the problems of large error cost in the average error period of passenger volume forecast results, small error cost in time period, complex forecasting, etc., and achieve high forecasting stability sexual effect

Active Publication Date: 2022-03-29
SOUTH CHINA UNIV OF TECH
View PDF2 Cites 0 Cited by
  • Summary
  • Abstract
  • Description
  • Claims
  • Application Information

AI Technical Summary

Problems solved by technology

However, there are defects in each of them. For example, the statistical forecasting method simply analyzes the passenger flow law from the perspective of data statistics, and its forecasting quality largely depends on the quality of statistical data. Therefore, such methods are not accurate and reliable.
Compared with the total line passenger flow, because the cross-section passenger flow involves the distribution of passenger boarding and alighting numbers along the line, its prediction will be more complex and uncertain
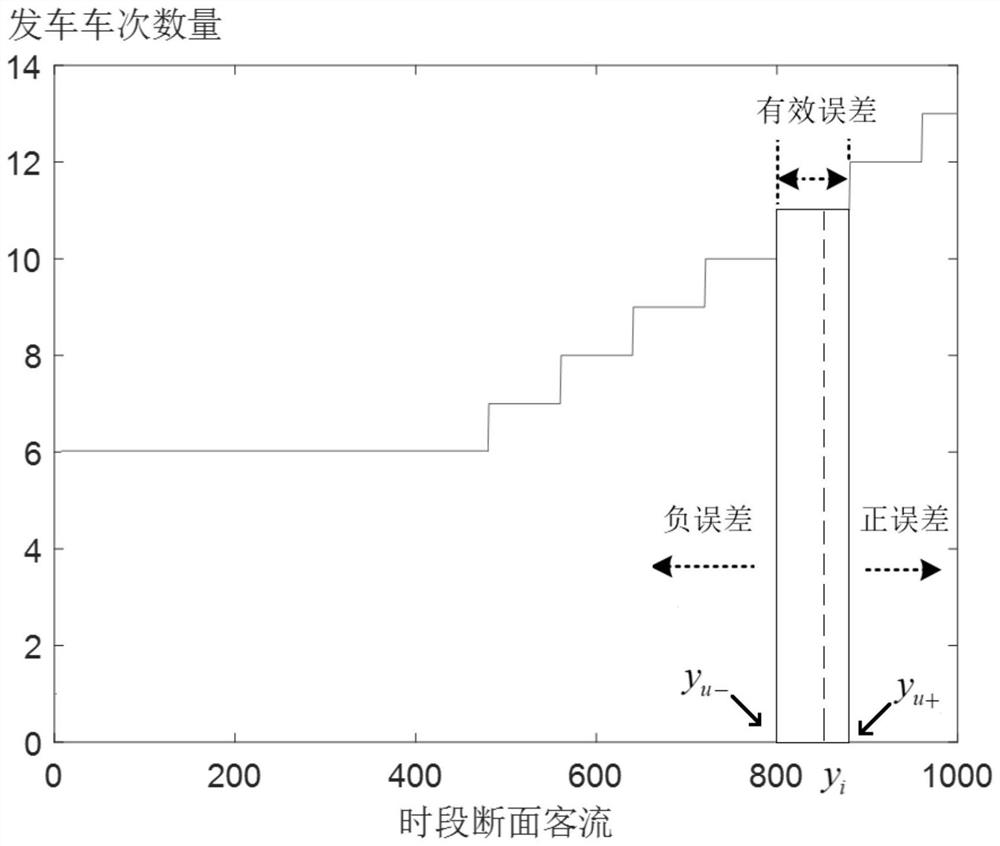
[0005] As mentioned above, the number of departures during the operating period depends on the predicted value of the highest cross-section passenger flow. When the forecast error of the cross-section passenger flow during an operating period does not lead to changes in the number of departures, the prediction results are used as the decision-making basis for public transport capacity deployment It is reliable, but if the cross-section passenger flow prediction error of a certain operation period does not reach or exceed the carrying capacity of the planned vehicle, using it as a public transport capacity will result in insufficient or wasted capacity, and the resulting operating loss (trips Too many passengers or stranded passengers) is the cost loss caused by the forecast error, that is, the error cost
Therefore, there are cases where the average error of the passenger volume prediction results in each operating period is small but the error cost is too large in some periods, and there are also situations where the average error is large but the error cost is small in most periods
Most of the existing technologies follow the traditional evaluation method with the goal of the lowest average error. Although this method has better prediction results, it is not applicable in the actual bus operation management with the goal of matching the transport capacity with the traffic volume.

Method used


Image

  • A Passenger Flow Prediction Method for the Highest Section of a Bus Line
  • A Passenger Flow Prediction Method for the Highest Section of a Bus Line
  • A Passenger Flow Prediction Method for the Highest Section of a Bus Line

Examples


Embodiment 1

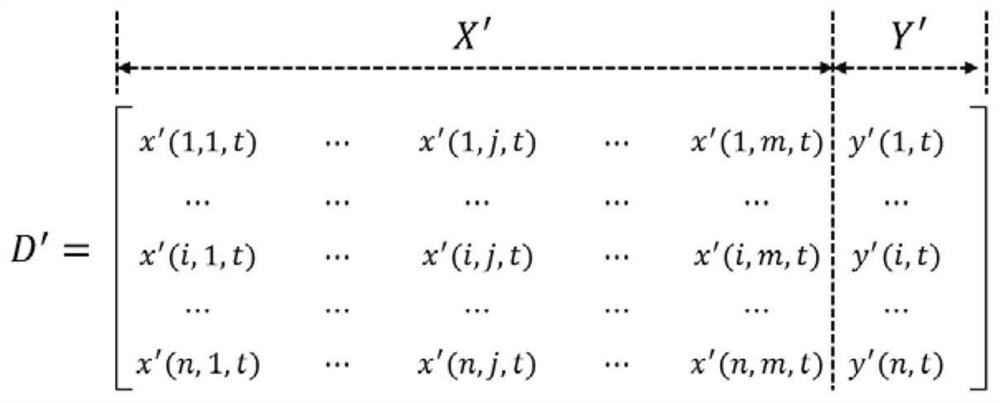
[0066] 1. Establishment of data space for factors affecting passenger flow at bus sections

[0067] The passenger flow of a bus section in a period is affected by many factors, including date, working day / holiday, weather, temperature and other factors. These multi-source data are not difficult to obtain under the existing information conditions, and can be used as short-term future section passenger flow forecasts effective basis. In the interpolation model, each influencing factor must be quantified as an effective model parameter to participate in the establishment and prediction process of the model. For this reason, the present invention utilizes the concept of feature engineering [Murphy K P. Machine Learning: AProbabilistic Perspective [M]. MIT Press, 2012.] abstracted and quantified the impact factors of the research object into multidimensional vectors, and removed dimension effects through standardization.

[0068] Define the sample impact factor sequence as: {x(i,j...


PUM


Abstract

The invention discloses a method for predicting passenger flow at the highest section of a bus line, comprising the steps of: extracting the influencing factors of the passenger flow at each section of the bus line at each time period, and establishing a data space; proposing an evaluation index based on prediction error cost; In the process of parameter optimization, the passenger flow of the cross-section in the target period is predicted by Shepard interpolation algorithm. The present invention uses an interpolation algorithm for forecasting, has high forecasting stability, and performs better in a forecasting model with forecasting error cost as an evaluation index, and can provide reference for bus line departure frequency setting, transport capacity delivery, and optimal full load rate. At the same time, using the idea of ​​"newsboy model", an evaluation index based on prediction error cost is proposed, which comprehensively reflects the redundant cost of trips and the cost of passenger retention caused by insufficient trips, and provides a more direct reference for the subsequent optimization of bus departure frequency.

Description

technical field [0001] The invention relates to the field of passenger flow prediction in public transport operation management, in particular to a method for predicting passenger flow at the highest section of a bus line based on error cost and Shepard interpolation. Background technique [0002] One of the basic goals of bus service is to ensure that the passenger capacity in a given period of time is compatible with the maximum passenger flow along the bus line. According to the forecast time span, passenger flow forecasting can be divided into long-term passenger flow forecasting and short-term passenger flow forecasting. Long-term passenger flow forecasting Forecasting generally serves public transport system infrastructure construction and route planning, while short-term passenger flow forecasting generally serves public transport operation management, vehicle personnel scheduling, etc. [0003] For short-term bus passenger flow forecasting, the methods currently used...

Claims


Application Information

Patent Timeline
Patent Type & Authority Patents(China)
IPC IPC(8): G06Q10/04G06N3/12G06Q10/06G06Q50/30
CPCG06N3/126G06Q10/04G06Q10/06393G06Q50/30
Inventor 巫威眺靳文舟李鹏任婧璇
Owner SOUTH CHINA UNIV OF TECH
Learn More