A two-dimensional display method for the development trend of news events simulating cell reproduction
A technology of development trends and news, applied in the field of network information, can solve the problems of low novelty and achieve good practicability and good display effect
- Summary
- Abstract
- Description
- Claims
- Application Information
AI Technical Summary
Problems solved by technology
Method used
Image

Examples
Embodiment 1
[0044] A two-dimensional display method for simulating the development trend of news events of cell reproduction, which mainly includes the following steps:
[0045] Step S101: Use distributed crawler technology to crawl the news texts of the website, and obtain different news texts describing the same news event through text clustering algorithm; the news texts include news titles, content, number of comments, number of reposts, and number of likes , time and place of occurrence; continue to crawl the website for the same news event and update the news text;
[0046] Step S102: Carry out positive and negative semantic sentiment analysis on the comments of each news text, and classify the comments into positive, negative and neutral according to the emotional tendency of each comment;
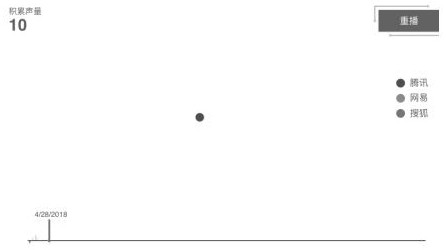
[0047] Step S103: data visualization, using a two-dimensional display with animation effects: first draw the first quadrant of the two-dimensional coordinates, the horizontal axis of the two-di...
Embodiment 2
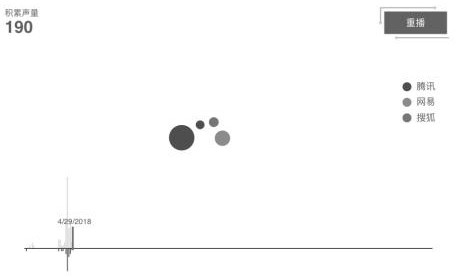
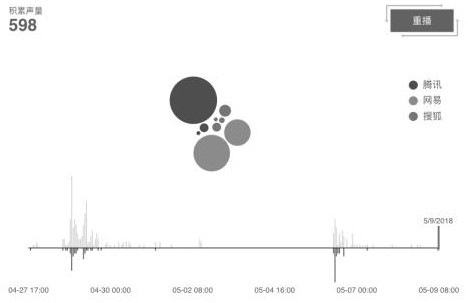
[0050] This embodiment is further optimized on the basis of embodiment 1, as Figure 1-3 As shown, within 14 days after the announcement of the news, the background supervision is carried out on the news text and the news text is continuously captured. The step S103 simultaneously displays the cumulative popularity and negative popularity of all news texts involved in the event in the two-dimensional coordinates in the time interval; perform three-dimensional statistical analysis on all news texts involved in the event:
[0051] a. Calculate the cumulative popularity of the news as of now, which is the statistical value of the sum of the number of comments, reposts and likes of all news texts;
[0052] b. Calculate the negative popularity of the news as of now, the negative popularity is the statistical value of the sum of the negative comments of all news texts;
[0053] c. Calculate the media reach of the news, and count the media volume of all the news texts involved in th...
Embodiment 3
[0057] This embodiment is described in embodiment 1 or 2, when new news texts appear in the event, the cell-shaped graphics in the two-dimensional coordinates will present the animation effect of splitting cells; when new news texts appear in the event, then The cell-like graphics in the two-dimensional coordinates will show the animation effect of splitting cells; in the animation display of the two-dimensional coordinates, the cell-like graphics of the news texts will be displayed in the chronological order of the news texts, thus showing the animation effect of cell division.
[0058] In the step S103, the cell-like figure can be a circular or elliptical structure, and the diameter of the cell-like figure is the total popularity of the news text as of the time point of statistics, and the total popularity is the news within the current time period. The statistical value of the sum of the total number of comments, reposts and likes of the news text.
[0059] The present inve...
PUM
 Abstract
Description
Claims
Application Information
 - R&D
- Intellectual Property
- Life Sciences
- Materials
- Tech Scout
- Unparalleled Data Quality
- Higher Quality Content
- 60% Fewer Hallucinations
Browse by: Latest US Patents, China's latest patents, Technical Efficacy Thesaurus, Application Domain, Technology Topic, Popular Technical Reports.
© 2025 PatSnap. All rights reserved.Legal|Privacy policy|Modern Slavery Act Transparency Statement|Sitemap|About US| Contact US: help@patsnap.com