ECG Waveform Simulation Method
A simulation method and electrocardiogram technology, applied in the field of medical teaching, can solve the problems of the limited number of effective electrocardiogram cases for medical students, the physical and mental impact of patients, and disadvantages, and achieve the effect of enriching clinical teaching cases
- Summary
- Abstract
- Description
- Claims
- Application Information
AI Technical Summary
Problems solved by technology
Method used
Image
Examples
example 1
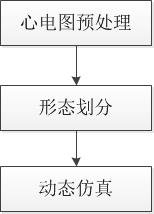
[0093] Instance 1, such as Figure 5 As shown in the ECG simulation method, the specific steps include:
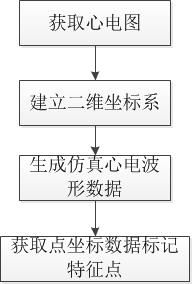
[0094] S1, ECG preprocessing,
[0095] S11, obtain the clinical electrocardiogram, as shown in A1, it is a normal electrocardiogram waveform,
[0096] S12, establishing a two-dimensional coordinate system,
[0097] S13, generating the simulated ECG waveform data, wherein taking the II lead waveform in Figure A1 as an example, intercepting the II lead waveform in Figure A1, and generating the simulated ECG waveform as shown in A2,
[0098] S14, by linear interpolation method, obtain point coordinate data evenly distributed in time on Figure A2, and mark characteristic points, including P wave start point, QRS wave group start point, T wave end point.
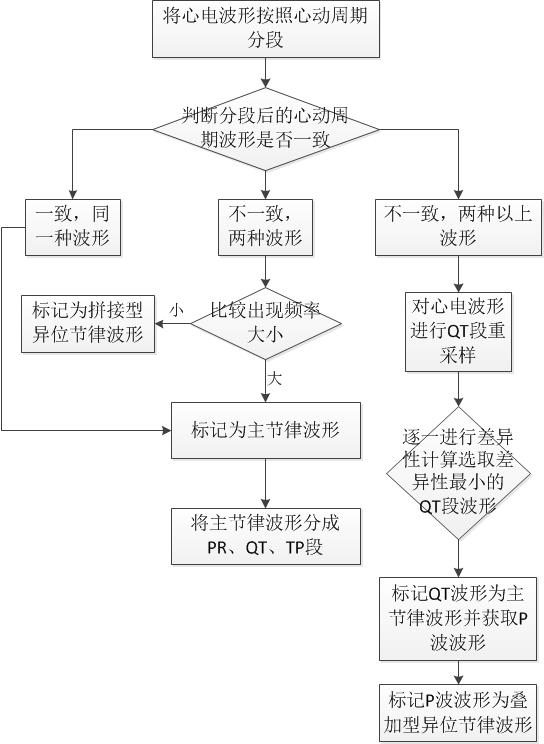
[0099] S2, performing morphological division on the preprocessed ECG according to the waveform features,
[0100] S21, according to the cardiac cycle, the simulated ECG waveform in Figure A2 is segmented, that is, from th...
example 2
[0112] Instance 2, such as Image 6 As shown in the ECG simulation method, the specific steps include:
[0113] S1, ECG preprocessing,
[0114] S11, obtain the clinical electrocardiogram, as shown in B1, it is the electrocardiogram waveform of the case of single ventricular premature systole,
[0115] S12, establishing a two-dimensional coordinate system,
[0116] S13, generating the simulated ECG waveform data, wherein taking the II lead waveform in Figure B1 as an example, intercepting the II lead waveform in Figure B1, and generating the simulated ECG waveform as shown in B2,
[0117] S14, by linear interpolation method, obtain point coordinate data uniformly distributed in time on Figure B2, and mark feature points, including P wave start point, QRS wave group start point, T wave end point.
[0118] S2, performing morphological division on the preprocessed ECG according to the waveform features,
[0119] S21, segmenting the simulated ECG waveform in Figure B2 according...
example 3
[0131] Example 3, such as Figure 7 As shown in the ECG simulation method, the specific steps include:
[0132] S1, ECG preprocessing,
[0133] S11, obtain the clinical electrocardiogram, as shown in C1, it is the electrocardiogram waveform of a case of third-degree atrioventricular block and high block,
[0134] S12, establishing a two-dimensional coordinate system,
[0135] S13, generating the simulated ECG waveform data, wherein taking the II lead waveform in Figure C1 as an example, intercepting the II lead waveform in Figure C1, and generating the simulated ECG waveform as shown in C2,
PUM
 Abstract
Description
Claims
Application Information
 - R&D Engineer
- R&D Manager
- IP Professional
- Industry Leading Data Capabilities
- Powerful AI technology
- Patent DNA Extraction
Browse by: Latest US Patents, China's latest patents, Technical Efficacy Thesaurus, Application Domain, Technology Topic, Popular Technical Reports.
© 2024 PatSnap. All rights reserved.Legal|Privacy policy|Modern Slavery Act Transparency Statement|Sitemap|About US| Contact US: help@patsnap.com


