A Spatial Analysis Method for the Interaction of Carbon Dioxide Emissions Elements at a Fine Spatial and Temporal Scale

A carbon dioxide and space emission technology, applied in the field of cities and ecological environment, can solve the problems of large differences in the impact of carbon dioxide emissions, no solutions, and low spatial and temporal precision.

Active Publication Date: 2022-01-28
INST OF GEOGRAPHICAL SCI & NATURAL RESOURCE RES CAS
View PDF4 Cites 0 Cited by
  • Summary
  • Abstract
  • Description
  • Claims
  • Application Information

AI Technical Summary

Problems solved by technology

At present, the time scales of research data related to urban carbon dioxide emissions at home and abroad are mostly annual and daily scales, and the spatial scales are mostly urban scales, with low temporal and spatial precision, which cannot effectively reveal the internal carbon dioxide in large cities (here refers to cities with a population of more than 1 million). However, road traffic, population density, vegetation, and soil in different areas of large cities have great differences in the impact of urban carbon dioxide emissions. For example, the range of carbon dioxide flux in a 10km×10km grid space scale in large cities in the United States reaches 20-160kgCm -2 yr -1 , therefore, cities urgently need to formulate policies on a finer spatial and temporal scale to significantly reduce carbon dioxide emissions
[0003] Existing flux observations in the field of ecology can determine the flux of carbon dioxide at the micro-spatial scale, but cannot effectively identify its source; human geography can calculate the carbon dioxide emissions of major carbon sources at the micro-spatial scale through household surveys, model simulations, and other methods , but what are the CO2 emissions from that space? How big is the contribution of each major carbon source? How is the spatial distribution? However, most of the studies on carbon dioxide emissions at fine spatio-temporal scales in large cities focus on the total carbon dioxide emissions in the target region or the spatio-temporal change process of carbon dioxide emissions from single carbon sources such as traffic, buildings, vegetation, and soil. , while big cities are areas with complex carbon dioxide emissions, existing research cannot objectively reveal the inherent process characteristics of carbon dioxide emissions from multiple carbon sources in urban micro-space
However, at present, the accounting ranges and methods of various elements of carbon dioxide sequestration are not uniform, which leads to large differences in the accounting results of various elements of carbon dioxide emissions.
In addition, the existing carbon dioxide emission accounting can only conduct statistics on the emissions in the region, and analyze the influence of various elements on the carbon dioxide flux in the whole region, which cannot reflect the spatial distribution of carbon dioxide emissions in the region, and it is impossible to calculate the carbon dioxide emissions based on the spatial distribution. Analysis of mutual spatial influence among solid removal elements, and determination of the degree of influence on carbon dioxide flux in the entire target area
[0004] For the above problems, there is still no feasible solution

Method used


Image

  • A Spatial Analysis Method for the Interaction of Carbon Dioxide Emissions Elements at a Fine Spatial and Temporal Scale
  • A Spatial Analysis Method for the Interaction of Carbon Dioxide Emissions Elements at a Fine Spatial and Temporal Scale
  • A Spatial Analysis Method for the Interaction of Carbon Dioxide Emissions Elements at a Fine Spatial and Temporal Scale

Examples


Embodiment Construction

[0041] The details of the present invention can be understood more clearly with reference to the accompanying drawings and the description of specific embodiments of the present invention. However, the specific embodiments of the present invention described here are only for the purpose of explaining the present invention, and should not be construed as limiting the present invention in any way. Under the teaching of the present invention, the skilled person can conceive any possible modification based on the present invention, and these should be regarded as belonging to the scope of the present invention.

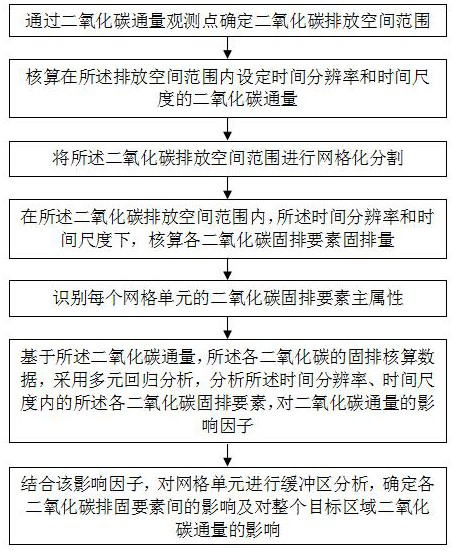
[0042] figure 1 It is the flow chart of the method in the embodiment of the present invention, as figure 1 As shown, the applicant proposes a spatial analysis method for the influence of carbon dioxide emission elements on a fine spatio-temporal scale, which includes the following steps:

[0043] Step 1: Obtain remote sensing images of the target area, set the observati...


PUM


Abstract

The invention discloses a spatial analysis method for the influence of carbon dioxide emission elements on a fine spatio-temporal scale. The method includes: determining the spatial range of carbon dioxide emission through observation points of carbon dioxide flux; calculating the carbon dioxide flux within the spatial range of carbon dioxide emission; The carbon dioxide emission spatial range is divided into grids; the carbon dioxide solid emission elements are calculated one by one within the carbon dioxide emission spatial range; the main attributes of the carbon dioxide solid emission elements are identified for each grid unit, and the Based on the above accounting data, the multiple regression analysis method was used to obtain the influence factors of the above-mentioned carbon dioxide solid emission elements on the carbon dioxide flux; combined with the influence factors, a buffer analysis was performed on the grid units to determine the relationship between the various carbon dioxide solid emission elements. impact and impact on CO2 fluxes across the target area.

Description

technical field [0001] The invention relates to the field of cities and the ecological environment, in particular to a spatial analysis method for the influence of carbon dioxide emission elements on a fine temporal and spatial scale. Background technique [0002] Urban areas contribute more than 70% of global carbon dioxide emissions and have already had a profound impact on the global carbon cycle and climate change. At present, the time scales of research data related to urban carbon dioxide emissions at home and abroad are mostly annual and daily scales, and the spatial scales are mostly urban scales, with low temporal and spatial precision, which cannot effectively reveal the internal carbon dioxide in large cities (here refers to cities with a population of more than 1 million). However, road traffic, population density, vegetation, and soil in different areas of large cities have great differences in the impact of urban carbon dioxide emissions. For example, the range...

Claims


Application Information

Patent Timeline
Patent Type & Authority Patents(China)
IPC IPC(8): G06Q50/26G06V20/10
CPCG06Q50/26G06V20/13Y02P90/84
Inventor 李宇袁靓石广义
Owner INST OF GEOGRAPHICAL SCI & NATURAL RESOURCE RES CAS
Why Eureka
Try Eureka