
Data display method and device

A data display and data technology, applied in the field of network communication, can solve problems such as reducing the efficiency of data display, and achieve the effect of improving efficiency

Inactive Publication Date: 2017-02-15
HANGZHOU DPTECH TECH
View PDF3 Cites 8 Cited by
  • Summary
  • Abstract
  • Description
  • Claims
  • Application Information

AI Technical Summary

Problems solved by technology

[0002] Charts are usually used to display data. Commonly used are line charts, pie charts, histograms, etc. Although these charts can clearly show the relationship between data, these charts can only describe one dimension of the data. If it involves The problem described from the two dimensions of the data needs to be described by two pictures, which reduces the efficiency of data display

Method used


Image

  • Data display method and device
  • Data display method and device
  • Data display method and device

Examples


Embodiment Construction

[0018] Reference will now be made in detail to the exemplary embodiments, examples of which are illustrated in the accompanying drawings. When the following description refers to the accompanying drawings, the same numerals in different drawings refer to the same or similar elements unless otherwise indicated. The implementations described in the following exemplary embodiments do not represent all implementations consistent with this application. Rather, they are merely examples of apparatuses and methods consistent with aspects of the present application as recited in the appended claims.

[0019] The terminology used in this application is for the purpose of describing particular embodiments only, and is not intended to limit the application. As used in this application and the appended claims, the singular forms "a", "the", and "the" are intended to include the plural forms as well, unless the context clearly dictates otherwise. It should also be understood that the term...


PUM


Abstract

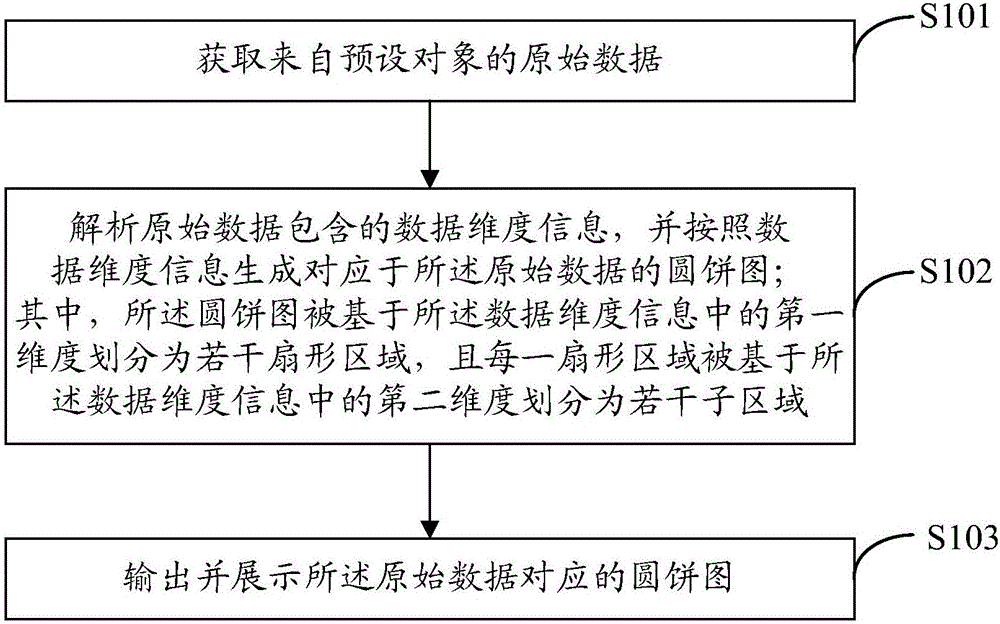
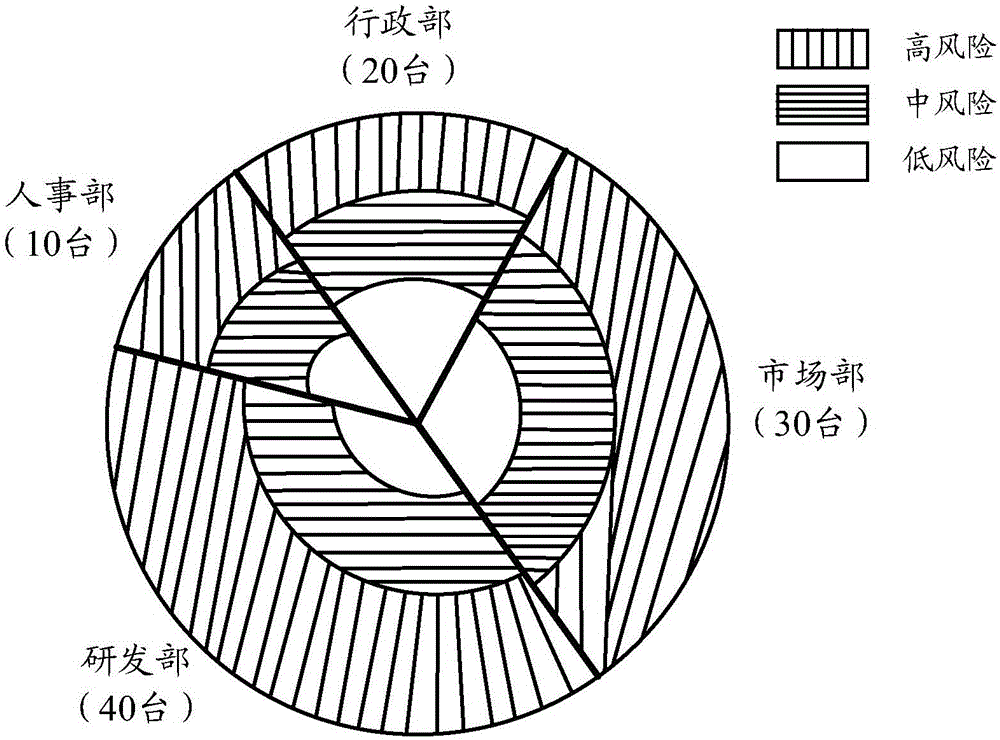
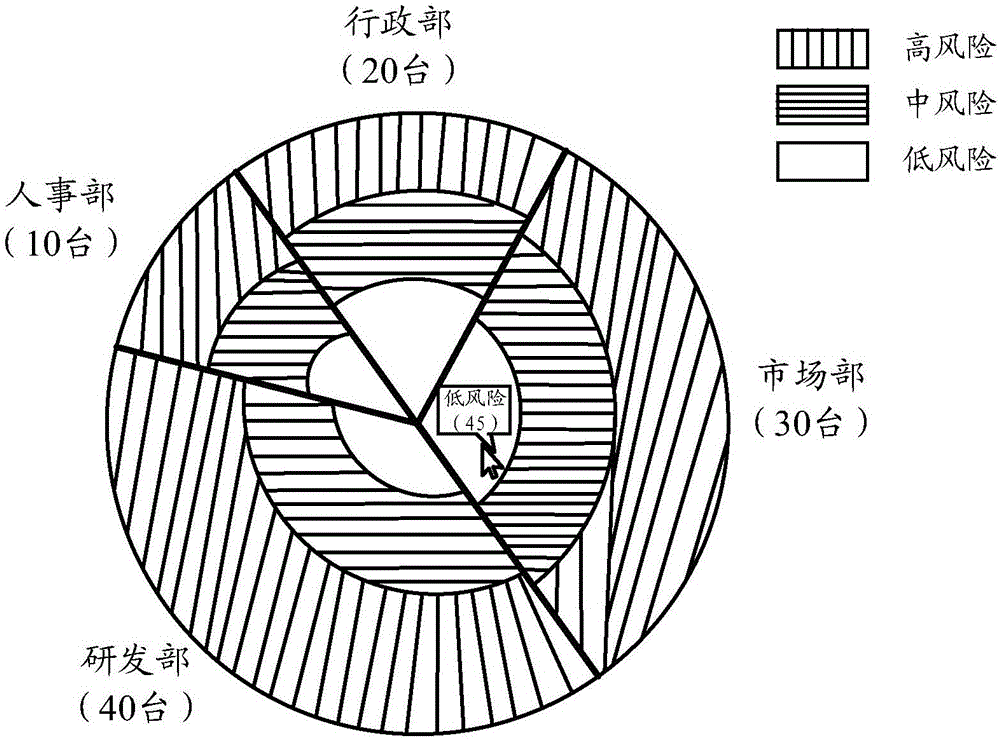
The invention provides a data display method and a data display device. The method comprises the steps of acquiring original data from a preset object; analyzing data dimension information included by the original data, and generating a pie chart corresponding to the original data according to the data dimension information, wherein the pie chart is divided into a plurality of sector domains based on a first dimension in the data dimension information, and each sector domain is divided into a plurality of sub-domains based on a second dimension in the data dimension information; and outputting and displaying the pie chart corresponding to the original data. Therefore, the purpose of displaying data information of the original data under two dimensions via one pie chart is achieved, utilization of the plurality of charts for embodying the two dimensions of the data is avoided, integrity of the data is embodied, and data display efficiency is improved.

Description

technical field [0001] The present application relates to the technical field of network communication, in particular to a data display method and device. Background technique [0002] Charts are usually used to display data. Commonly used are line charts, pie charts, histograms, etc. Although these charts can clearly show the relationship between data, these charts can only describe one dimension of the data. If it involves The problem described from the two dimensions of the data needs to be described by two pictures, which reduces the efficiency of data display. Contents of the invention [0003] In view of this, the present application provides a data display method and device, which can simultaneously display two-dimensional data information on a pie chart, which can not only reflect the integrity of the data, but also improve work efficiency. [0004] Specifically, this application is achieved through the following technical solutions: [0005] According to a first...

Claims


Application Information

Patent Timeline
Patent Type & Authority Applications(China)
IPC IPC(8): G06F17/21G06T11/20
CPCG06F40/106G06F40/111G06T11/206
Inventor 江灵兵
Owner HANGZHOU DPTECH TECH
Learn More