Service quality monitoring method and equipment based on user perception

A service quality and user technology, applied in digital transmission systems, electrical components, transmission systems, etc., can solve the problems that network KPI indicators cannot be intuitive and truly reflect network quality, and achieve the effect of improving service perception experience

Active Publication Date: 2016-08-03
CHINA UNITED NETWORK COMM GRP CO LTD
View PDF4 Cites 19 Cited by
  • Summary
  • Abstract
  • Description
  • Claims
  • Application Information

AI Technical Summary

Problems solved by technology

However, in the era of high-traffic application of mobile Internet data services, a single network KPI indicator cannot intuitively and truly reflect network quality, especially the real service experience of users. Effectively monitor the quality of network services to timely discover links that affect user perception, and provide guidance for optimizing network performance and locating network problems

Method used


Image

  • Service quality monitoring method and equipment based on user perception
  • Service quality monitoring method and equipment based on user perception
  • Service quality monitoring method and equipment based on user perception

Examples


Embodiment Construction

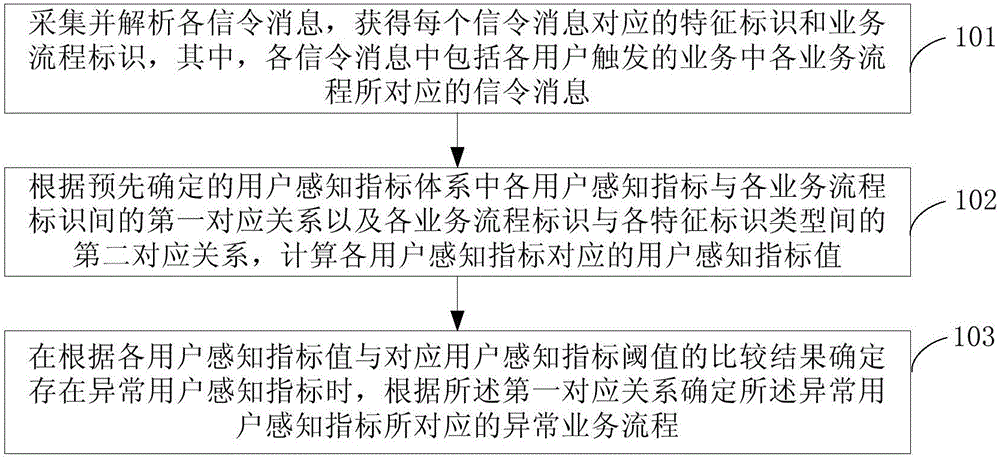
[0040] figure 1 This is a flowchart of Embodiment 1 of a method for monitoring service quality based on user perception of the present invention. In this embodiment, the method is executed by a monitoring device, such as figure 1 As shown, the method includes the following steps:

[0041] Step 101: Collect and analyze each signaling message to obtain a feature identifier and a service process identifier corresponding to each signaling message. Each signaling message includes a signaling message corresponding to each service process in the service triggered by each user.

[0042] Wherein, the characteristic identifier includes at least one of a user identifier, a network element identifier, and a service identifier.

[0043] Step 102: According to the first correspondence between each user perception indicator and each business process identifier in the predetermined user perception indicator system, and the second correspondence between each business process identifier and each featur...


PUM


Abstract

The invention provides a service quality monitoring method and equipment based on user perception. The method comprises the steps of acquiring and analyzing each signaling message, and acquiring a feature identifier and a service flow identifier corresponding to each signaling message; calculating a user perception indicator value corresponding to each user perception indicator according to a first corresponding relation between each user perception indicator and each service flow identifier and a second corresponding relation between each service flow identifier and each feature identifier type in a predetermined user perception indicator system; and in the presence of an abnormal user perception indicator, determining an abnormal service flow corresponding to the abnormal user perception indicator according to the result of comparing each user perception indicator with a corresponding user perception indicator threshold. By measuring the user perception of multiple feature dimension of each service flow, the abnormal service flow based on user perception indicator location is more accurate, and the user perception experience can be improved.

Description

Technical field [0001] The invention belongs to the technical field of wireless communication, and specifically relates to a method and equipment for monitoring service quality based on user perception. Background technique [0002] With the increasing complexity of the popularization of smart terminals, the mobile network has evolved from a single voice service application era to a data service high-traffic application era. The direction of data network optimization has shifted from the traditional Key Performance Indicators (KPI) optimization. To better reflect the user’s true perception of quality of experience (Quality of Experience, QOE) complaints and optimization of user satisfaction indicators. [0003] In the era of traditional voice services, network quality is mainly evaluated by network KPIs such as call-through rate, call drop rate, and SMS call-through rate. When the KPI is good, the customer perception is good. However, in the era of high-traffic applications of mob...

Claims


Application Information

Patent Timeline
Patent Type & Authority Applications(China)
IPC IPC(8): H04W24/08H04L12/24
CPCH04W24/08H04L43/55
Inventor 杨秀平张哲冯军吴奇章力刘文华
Owner CHINA UNITED NETWORK COMM GRP CO LTD
Why Eureka
Try Eureka