
Pie chart manufacturing method of interactive electronic white board

A technology of electronic whiteboard and production method, which is applied in image data processing, electronic digital data processing, 2D image generation, etc., and can solve the problems of tediousness, no image update, and increased difficulty of user modification

Inactive Publication Date: 2016-07-06
RETURNSTAR INTERACTIVE TECH GRP
View PDF3 Cites 4 Cited by
  • Summary
  • Abstract
  • Description
  • Claims
  • Application Information

AI Technical Summary

Problems solved by technology

[0002] If you want to modify the data of the pie chart of the interactive electronic whiteboard software, you can only modify the data represented by the pie chart. Customers need to perform cumbersome operations before changing the data. After changing the data, sometimes images will appear It is not updated, it is still the original data, and there will be inconsistency; or the user needs to adjust the image after the data is acquired, which is very inconvenient for users to use and increases the difficulty of user modification

Method used


Image

  • Pie chart manufacturing method of interactive electronic white board

Examples


Embodiment Construction

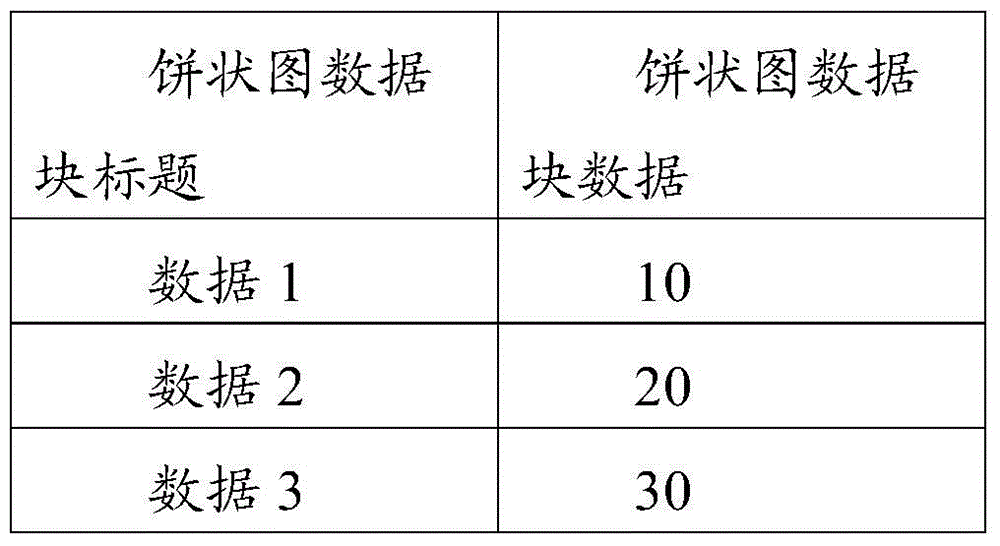
[0017] The pie chart making method of the interactive electronic whiteboard of the present invention comprises the following steps:

[0018] Step 1. Calculate the total iSum of all data block values ​​B;

[0019] Step 2. Calculate the angle size Ag3 of all data blocks, the method is B / iSum*360;

[0020] Step 3. Set the starting angle of the first data block in the pie chart to Ag4;

[0021] Step 4. The method of calculating the starting point position of each data block is as follows:

[0022] P1.x=P3.x+L1 / 2*Cos(Ag4*Pi / 180), P1.y=P3.y+L1 / 2*Sin(Ag4*Pi / 180); where Pi is the pi and P3 is the center of the circle , P3.x is the abscissa of the circle center P3, P3.y is the ordinate of the circle center P3, and L1 is the radius;

[0023] Step 5. The method of calculating the position of the termination point of each data block is as follows:

[0024] P2.x=P3.x+L1 / 2*Cos(Ag4*Pi / 180), P2.y=P3.y+L1 / 2*Sin(Ag4*Pi / 180);

[0025] Step 6. According to the calculated value, draw the sect...


PUM


Abstract

The invention provides a pie chart manufacturing method of an interactive electronic white board. The method comprises the following steps of calculating the sum iSum of all data block values B; calculating the angle size Ag3 of all data blocks according to a method of B / iSum*360; setting the initial angle of the first data block in the pie chart to be Ag4; respectively calculating the initial point position of each data block; respectively calculating the terminal point position of each data block; and drawing a fan shape corresponding to the value of each data block by using P3 as the circle center and L1 as the radius according to the calculated value to form the pie chart. The use by a user is convenient.

Description

technical field [0001] The invention relates to a method for making a pie chart of an interactive electronic whiteboard. Background technique [0002] If you want to modify the data of the pie chart in the interactive whiteboard software, you can only modify the data represented by the pie chart. The customer needs to perform tedious operations before changing the data. After changing the data, sometimes an image will appear. If it is not updated, it is still the original data, and there will be inconsistencies; or the user needs to adjust the image to a certain extent after the data is obtained, which is very inconvenient for the user to use and increases the difficulty of the user to modify. SUMMARY OF THE INVENTION [0003] The technical problem to be solved by the present invention is to provide a method for making a pie chart of an interactive electronic whiteboard, which is convenient for users to use. [0004] The present invention is achieved in this way: a method...

Claims


Application Information

Patent Timeline
IPC IPC(8): G06F3/0484G06T11/20
CPCG06F3/04845G06T11/203
Inventor 丁万年洪文洁陈日良池超奇
Owner RETURNSTAR INTERACTIVE TECH GRP
Learn More