Method for measuring pollutants by virtue of combination of three-dimensional fluorescence spectrum and PARAFAC algorithm
A three-dimensional fluorescence and pollutant technology, applied in fluorescence/phosphorescence, measurement device, material analysis by optical means, etc., can solve problems such as selectivity and sensitivity limitation, and achieve cumbersome compensation process, high sensitivity and good reproducibility. Effect
- Summary
- Abstract
- Description
- Claims
- Application Information
AI Technical Summary
Problems solved by technology
Method used
Image
Examples
Embodiment 1
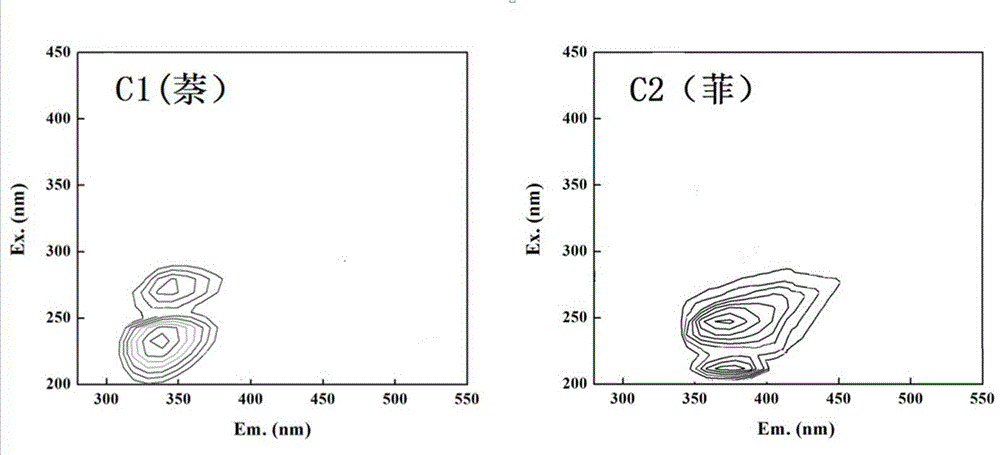
[0032] Select a variety of water samples with known concentrations of phenanthrene, pass through nitrogen to remove dissolved oxygen in the water samples, and filter the samples with a 0.45 μm microporous membrane. Take 4mL of the filtered sample and add it to a four-way cuvette, place it in a fluorescence spectrum analyzer with excitation and emission synchronization, set the excitation wavelength to 200-450nm, the emission wavelength to 280-550nm, the scanning distance to 5nm, and the 5nm, scanning speed 1200nm·min -1 Afterwards, the sample is scanned for all fluorescence data. Analyze the spectral data in the Matlab software equipped with PARAFAC algorithm toolbox, select the component in the result that meets the characteristic fluorescence spectrum peak position of the phenanthrene standard sample, export its corresponding X data value, and export it to the standard in the sample database In the curve, the corresponding concentration data are obtained.
Embodiment 2
[0034]Take 5g of naphthalene-contaminated soil samples with different known concentrations, ultrasonically extract them with 20mL of methanol for 30 minutes, centrifuge for 10 and recover the supernatant, repeat the above steps 3 times. Pass the recovered solution through the activated C18 extraction column, and elute with 10mL of n-hexane. After elution, blow off with nitrogen to nearly dryness, and use n-hexane to make the volume to 5mL. Take 2mL of the solution in the sample cell of the fluorescence photometer. Perform mapping of 3D fluorescence spectral scans. The instrument parameters are set as follows: the excitation wavelength is 200-450nm, the emission wavelength is 280-550nm, the scanning distance is 5nm, the slit width is 5nm, and the scanning speed is 1200nm·min -1 rear. The sample is scanned for all fluorescence data. Analyze the spectral data in the Matlab software equipped with the PARAFAC algorithm toolbox, select the component in the result that meets the ch...
PUM
 Abstract
Description
Claims
Application Information
 - R&D Engineer
- R&D Manager
- IP Professional
- Industry Leading Data Capabilities
- Powerful AI technology
- Patent DNA Extraction
Browse by: Latest US Patents, China's latest patents, Technical Efficacy Thesaurus, Application Domain, Technology Topic, Popular Technical Reports.
© 2024 PatSnap. All rights reserved.Legal|Privacy policy|Modern Slavery Act Transparency Statement|Sitemap|About US| Contact US: help@patsnap.com


