A Method for Predicting the Remaining Life of Corrosion Towers in Transmission Lines in Industrial Areas
A technology for life prediction and transmission lines, applied in the field of electric power engineering, to achieve high accuracy, prevent disconnection, and ensure safety
- Summary
- Abstract
- Description
- Claims
- Application Information
AI Technical Summary
Problems solved by technology
Method used
Image
Examples
Embodiment 1
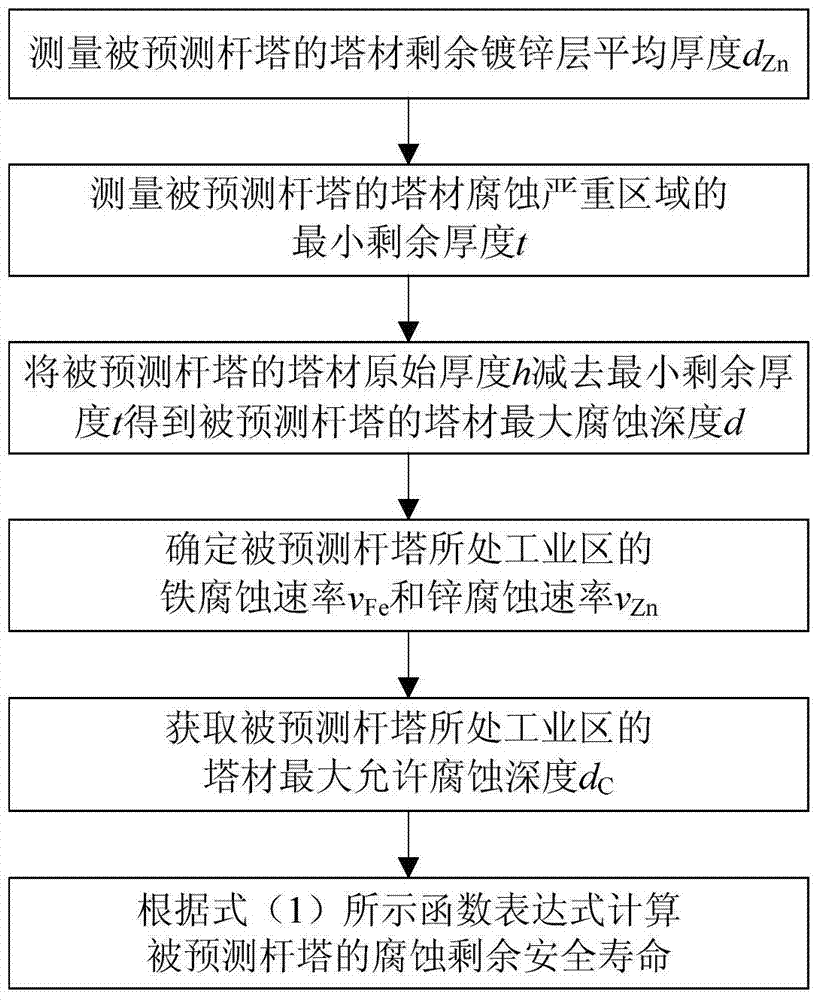
[0034] Such as figure 1 As shown, the steps of the method for predicting the remaining life of corrosion of transmission line towers in industrial areas in this embodiment include:
[0035] 1) Measure the average thickness d of the remaining galvanized layer of the tower material to be predicted Zn ; In this embodiment, the surface of the tower has been covered with red rust, so the average thickness d of the remaining galvanized layer of the tower is predicted Zn = 0;
[0036] 2) Measure the minimum remaining thickness t of the severely corroded area of the tower material of the predicted tower, and subtract the minimum remaining thickness t from the original thickness h of the tower material of the predicted tower to obtain the maximum corrosion depth d of the tower material of the predicted tower; in this embodiment , the original thickness h of the tower material is predicted to be 10mm, and the minimum remaining thickness t is 9mm, so the maximum corrosion depth d of ...
Embodiment 2
[0057] This embodiment is basically the same as Embodiment 1, and the main difference is that the implementation of step 3) is different.
[0058] In this embodiment, the detailed steps of step 3) include: first obtain the classification of the corrosion environment of the industrial area where the predicted tower is located, and then query the preset corrosion environment maximum corrosion rate comparison table (see Table 1) according to the classification of the corrosion environment to obtain The iron corrosion rate v of the industrial area where the predicted tower is located Fe and zinc corrosion rate v Zn .
[0059] Table 1: Comparison table of maximum corrosion rate in corrosive environment.
[0060]
[0061] The corrosive environment classification of the industrial area where the predicted tower is located can be obtained from the environmental monitoring center or atmospheric corrosion site where the predicted tower target is located. According to the provision...
Embodiment 3
[0064] This embodiment is basically the same as Embodiment 1, and the main difference is that the implementation of step 3) is different.
[0065] In this embodiment, the detailed steps of step 3) include: first directly calculate the iron corrosion rate v of the industrial area where the tower is located according to formula (3) Fe , and then according to the predicted iron corrosion rate v of the industrial area where the tower is located Fe Find the maximum corrosion rate comparison table of the preset corrosive environment (see Table 1), and obtain the zinc corrosion rate v of the industrial area where the predicted tower is located Zn ;
[0066] v Fe =1000(h-t)÷T (3)
[0067] In formula (3), v Fe is the iron corrosion rate in the industrial area where the predicted tower is located, h is the original thickness of the tower material of the predicted tower, t is the minimum remaining thickness of the severely corroded area of the tower material of the predicted tower,...
PUM
 Abstract
Description
Claims
Application Information
 - R&D Engineer
- R&D Manager
- IP Professional
- Industry Leading Data Capabilities
- Powerful AI technology
- Patent DNA Extraction
Browse by: Latest US Patents, China's latest patents, Technical Efficacy Thesaurus, Application Domain, Technology Topic, Popular Technical Reports.
© 2024 PatSnap. All rights reserved.Legal|Privacy policy|Modern Slavery Act Transparency Statement|Sitemap|About US| Contact US: help@patsnap.com


