A rapid analysis method for line loss in low-voltage distribution network

A low-voltage distribution network platform area and rapid analysis technology, applied in special data processing applications, instruments, electrical digital data processing, etc., can solve the difference between high and low influence of index line loss, reduce enterprise work efficiency, and increase line loss analysis Workload and other issues, to overcome the defects of the working mode, solve the problem of multi-collinearity, and achieve the effect of fast scientific calculation

Active Publication Date: 2018-05-15
SOUTH CHINA UNIV OF TECH
View PDF5 Cites 1 Cited by
  • Summary
  • Abstract
  • Description
  • Claims
  • Application Information

AI Technical Summary

Problems solved by technology

[0005] 1) The practicability of the line loss analysis index data in the low-voltage distribution network station area is low: although the collected line loss index data in the station area is sufficient, due to the lack of targeted line loss index analysis work, the influence of the index on the line loss is limited. The difference between high and low is poor, which increases the workload of line loss analysis;
[0006] 2) The large number of low-voltage distribution network stations leads to low efficiency of line loss analysis: when the power supply department conducts line loss analysis, it often measures most of the stations one by one. Although this can improve the accuracy of the analysis to a certain extent, however, This repetitive mechanical redundant work is not simple enough, which reduces the work efficiency of the enterprise;
[0007] 3) The line loss representativeness of typical low-voltage distribution network station areas is low: the existing methods for the screening and analysis of typical station areas lack systematic standards, are subjective, cumbersome, and inefficient, and are prone to errors and omissions. Comprehensive analysis and evaluation of the overall situation of the line loss in the low-voltage distribution network area in the region

Method used


Image

  • A rapid analysis method for line loss in low-voltage distribution network
  • A rapid analysis method for line loss in low-voltage distribution network
  • A rapid analysis method for line loss in low-voltage distribution network

Examples


Embodiment Construction

[0057] The present invention will be further described in detail below in conjunction with the embodiments and the accompanying drawings, but the embodiments of the present invention are not limited thereto.

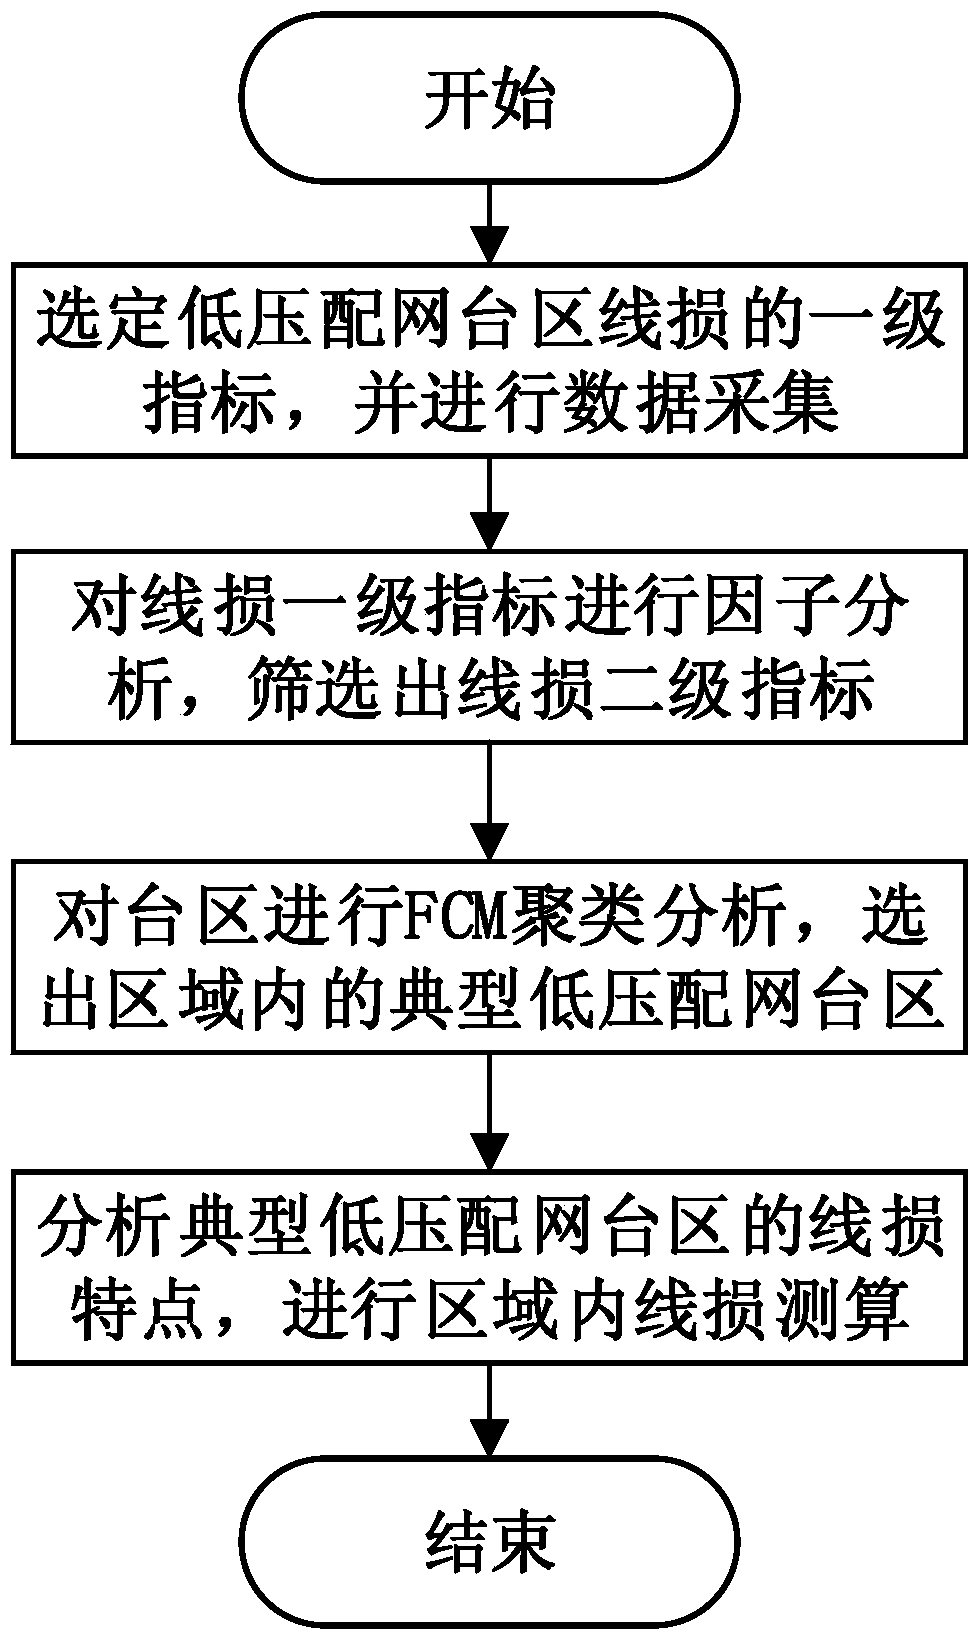
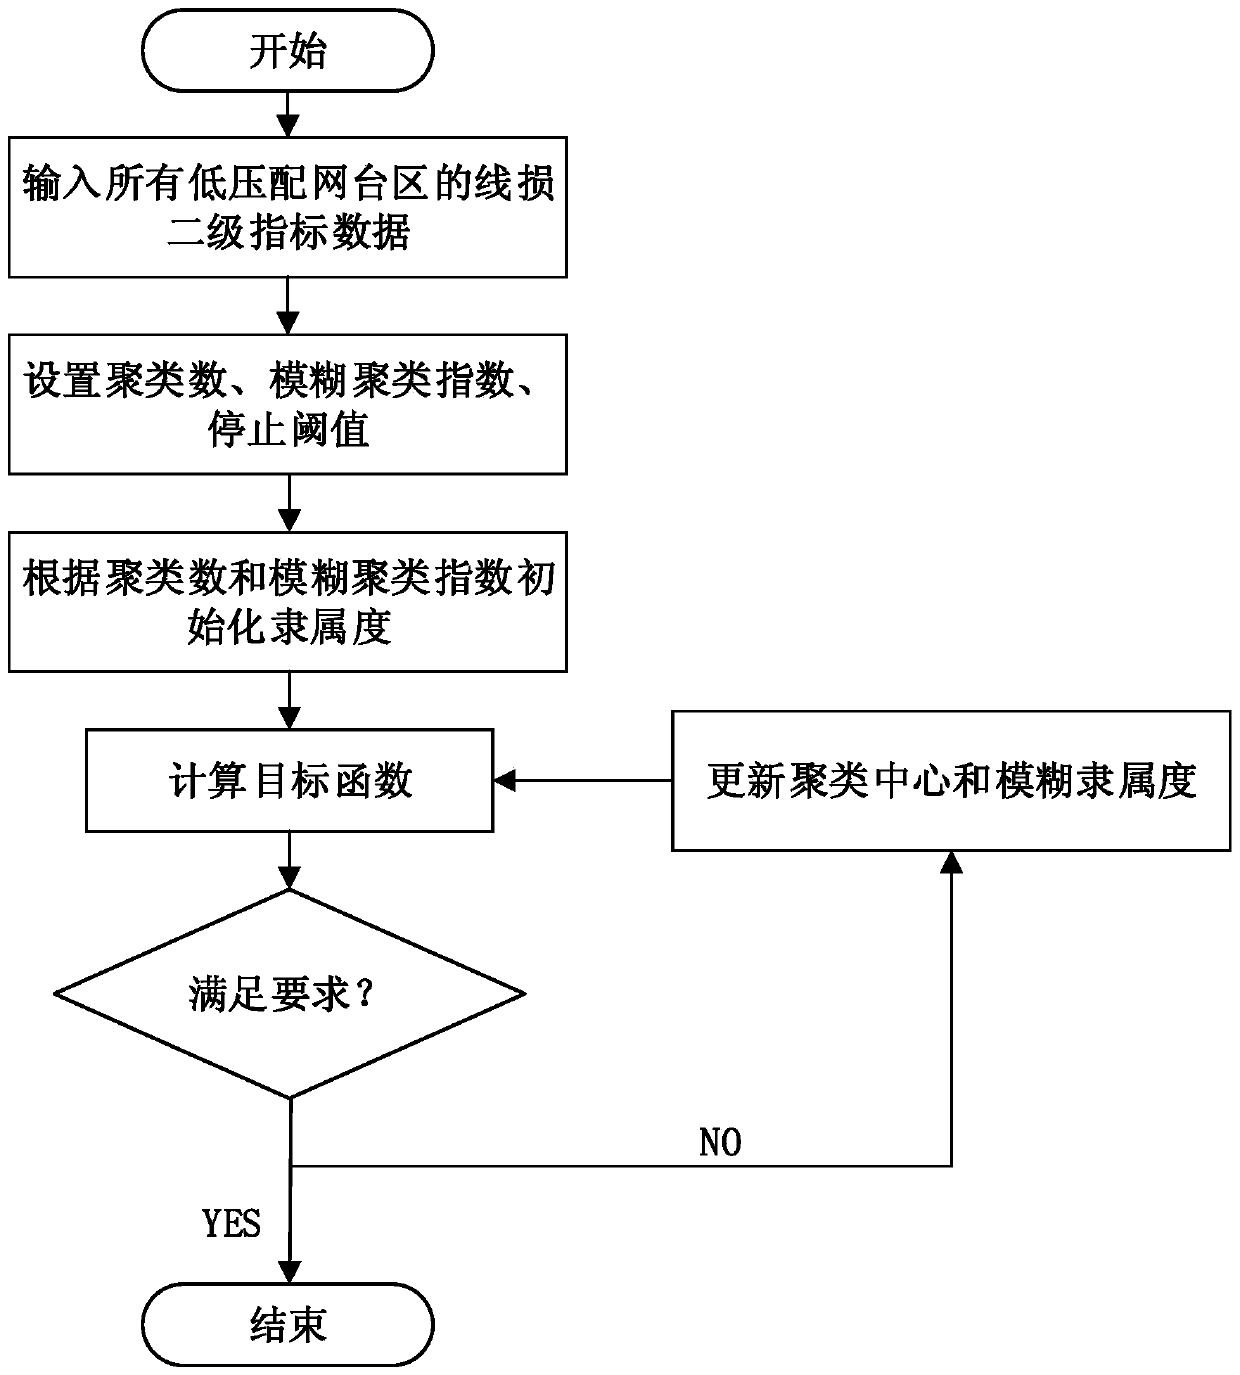
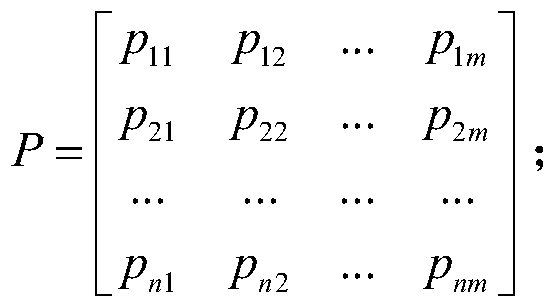
[0058] attached figure 1 It is a work flow chart of a rapid analysis method for line loss in low-voltage distribution network areas based on the FA-FCM classification principle. The basic steps are: first, collect and summarize the first-level indicators of line loss in low-voltage distribution network areas according to actual conditions , input the n×m order line loss first-level index data matrix to be screened; then, use FA to conduct factor analysis on the line loss first-level index data, and extract the line secondly, using the FCM algorithm, using the secondary index of line loss screened out in the factor analysis method, to cluster the regional stations and get the line loss analysis of various types Typical low-voltage distribution network area; finally, usin...


PUM


Abstract

The invention discloses a method for rapid analysis of line loss in a low-voltage distribution network station area, comprising the following steps: collecting and summarizing the first-level line loss indexes of the low-voltage distribution network station area according to actual conditions; adopting FA to factor the first-level line loss indexes Analysis, according to the FA classification results of the first-level index of line loss, the second-level line loss index with high contribution rate to line loss among various indicators is extracted; FCM is used to cluster the regional station area based on the second-level line loss index , summarize each cluster central station area, and obtain the regional typical low-voltage distribution network station area; use the typical analysis results of the line loss of the typical low-voltage distribution network station area to make an overall evaluation of the line loss of the low-voltage distribution network station area in the region. The analysis method of the invention can greatly improve the efficiency of the line loss analysis work in the low-voltage distribution network platform area.

Description

technical field [0001] The invention relates to the field of power line loss analysis, in particular to a rapid analysis method for line loss in a low-voltage distribution network area. Background technique [0002] Line loss is an important economic and technical assessment index of the power grid. It comprehensively reflects the planning and design, production operation and operation management level of the power grid. Reducing line loss is an important step for the power sector to save energy, create an international advanced power supply enterprise, and promote corporate management and control. other important tasks. The fast, accurate and simple line loss analysis method is conducive to efficiently formulating targeted loss reduction measures, formulating appropriate line loss assessment plans, promoting the development of the power grid to a more efficient and greener direction, and further realizing the enterprise's Lean management. [0003] The current line loss wo...

Claims


Application Information

Patent Timeline
Patent Type & Authority Patents(China)
IPC IPC(8): G06F17/50
Inventor 欧阳森安晓华
Owner SOUTH CHINA UNIV OF TECH
Why Eureka
Try Eureka