Hyperspectral image group sparse demixing method based on empty spectral information abundance restraint
A hyperspectral image, degree-constrained technology, applied in the field of sparse unmixing of hyperspectral image groups, can solve problems such as not considering regional structure information
- Summary
- Abstract
- Description
- Claims
- Application Information
AI Technical Summary
Problems solved by technology
Method used
Image
Examples
Embodiment 1
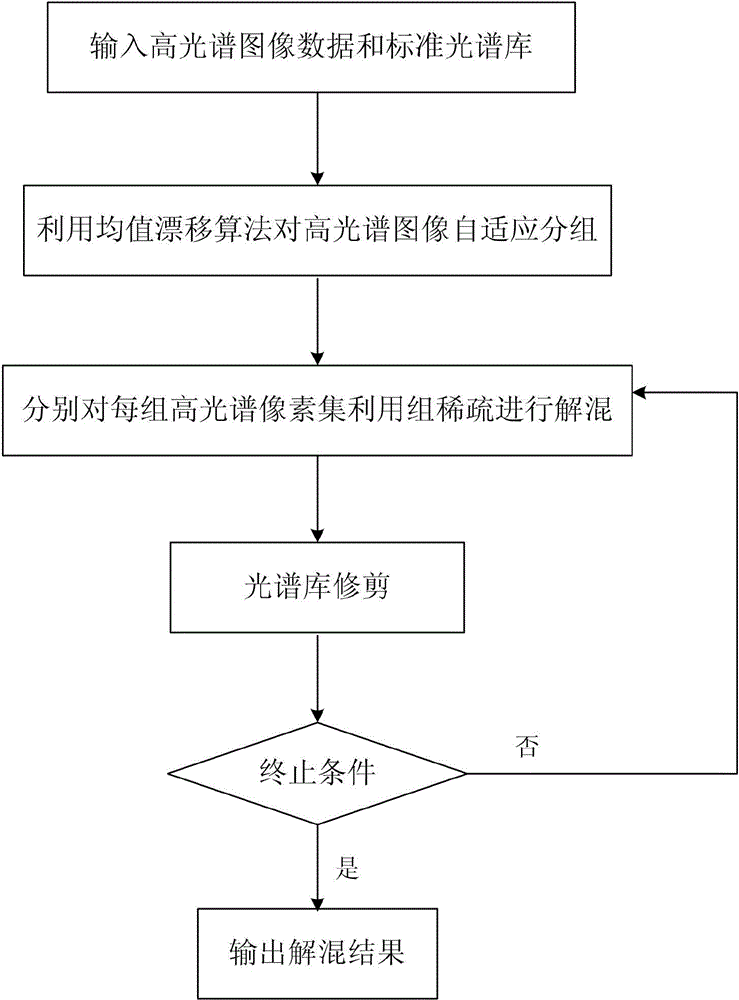
[0065] combined with figure 1 The concrete steps of the present invention are described as follows:
[0066] (1) Input hyperspectral image data and standard spectral library in is the spectral feature of the i-th pixel in the hyperspectral image data, is the jth ground object spectrum in the standard spectral library, L is the number of bands, n is the number of pixels, m is the number of ground object spectra contained in the spectral library, represents the field of real numbers;
[0067] The size of the simulated data set is 224×30×30, which consists of nine areas of the same size, three rows and three columns, each area is 10×10 in size, and the types and numbers of endmembers contained in each area are different. The simulated data set contains The number of endmembers is 9, the endmembers are randomly selected from the spectral library, and the abundance obeys the Dirichlet distribution.
[0068] Real data set: Mineral data set in the Nevada region of the Unit...
Embodiment 2
[0112] Attached below image 3 And attached Figure 4 The effects of the present invention are further described.
[0113] The simulation experiment of the present invention is realized on the MATLAB R2011b on the Windows 7 platform of Intel Core (TM) 2Duo CPU, main frequency 2.00GHz, internal memory 2G.
[0114] The simulation of the present invention is an experimental simulation done on a simulated data set and a real data set. The simulated data is composed of nine small blocks of 10×10, and each block contains different numbers of endmembers. Randomly selected, the abundance of all small blocks obeys the Dirichlet distribution, the simulated data set is 224×900, the data is interfered by different levels of Gaussian white noise, the signal-to-noise ratio SNR (dB) = Ε||Ax|| 2 / Ε||n|| 2 They are: 20dB, 30dB and 40dB.
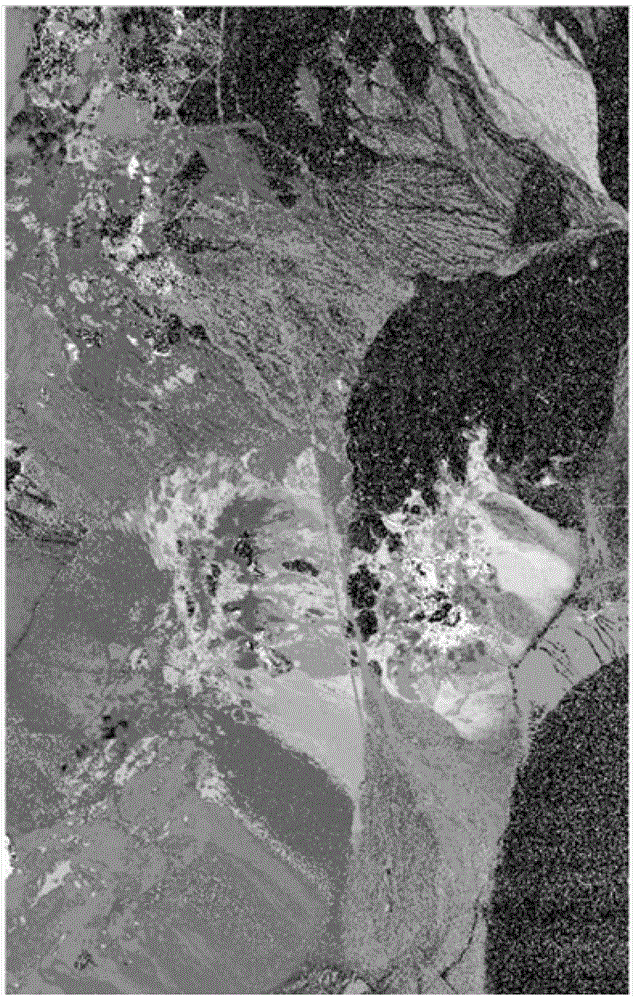
[0115] The real data is the mine data set in the Nevada region of the United States (as attached figure 2 shown), in which in the actual simulation pro...
PUM
 Abstract
Description
Claims
Application Information
 - R&D Engineer
- R&D Manager
- IP Professional
- Industry Leading Data Capabilities
- Powerful AI technology
- Patent DNA Extraction
Browse by: Latest US Patents, China's latest patents, Technical Efficacy Thesaurus, Application Domain, Technology Topic, Popular Technical Reports.
© 2024 PatSnap. All rights reserved.Legal|Privacy policy|Modern Slavery Act Transparency Statement|Sitemap|About US| Contact US: help@patsnap.com


