
Method for determining an expected consumption value of a motor vehicle

A consumption value, motor vehicle technology, applied in the direction of registration/indication of vehicle operation, prediction, data processing application, etc., can solve the problem of different data volume and so on

Active Publication Date: 2015-01-07
AUDI AG
View PDF6 Cites 3 Cited by
  • Summary
  • Abstract
  • Description
  • Claims
  • Application Information

AI Technical Summary

Problems solved by technology

[0005] The resulting problem is that, depending on the driving behavior and usage characteristics of the driver of a particular motor vehicle, the amount of data that exists in different driving situations is not the same

Method used


Image

  • Method for determining an expected consumption value of a motor vehicle
  • Method for determining an expected consumption value of a motor vehicle

Examples


Embodiment Construction

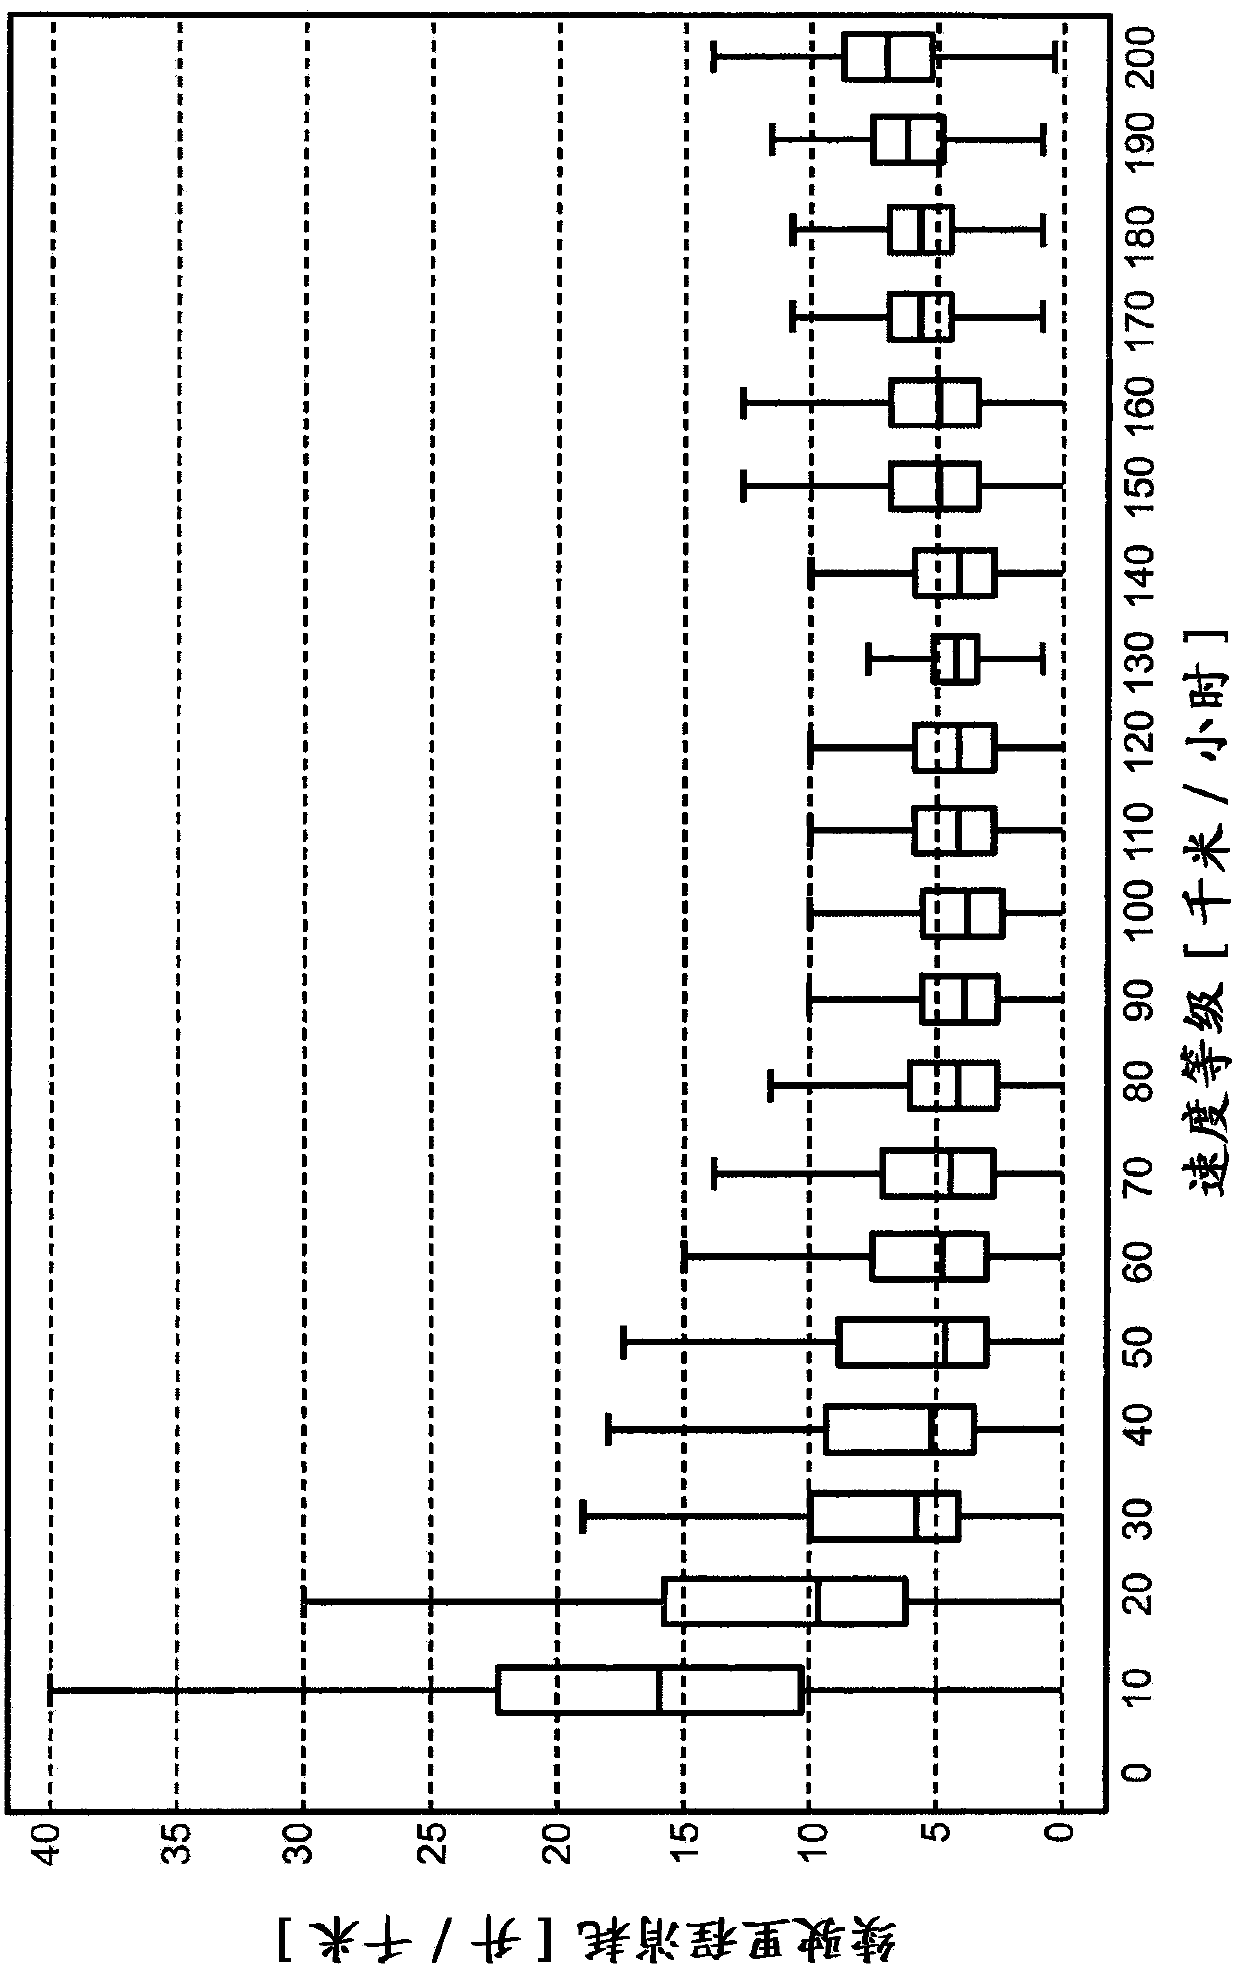
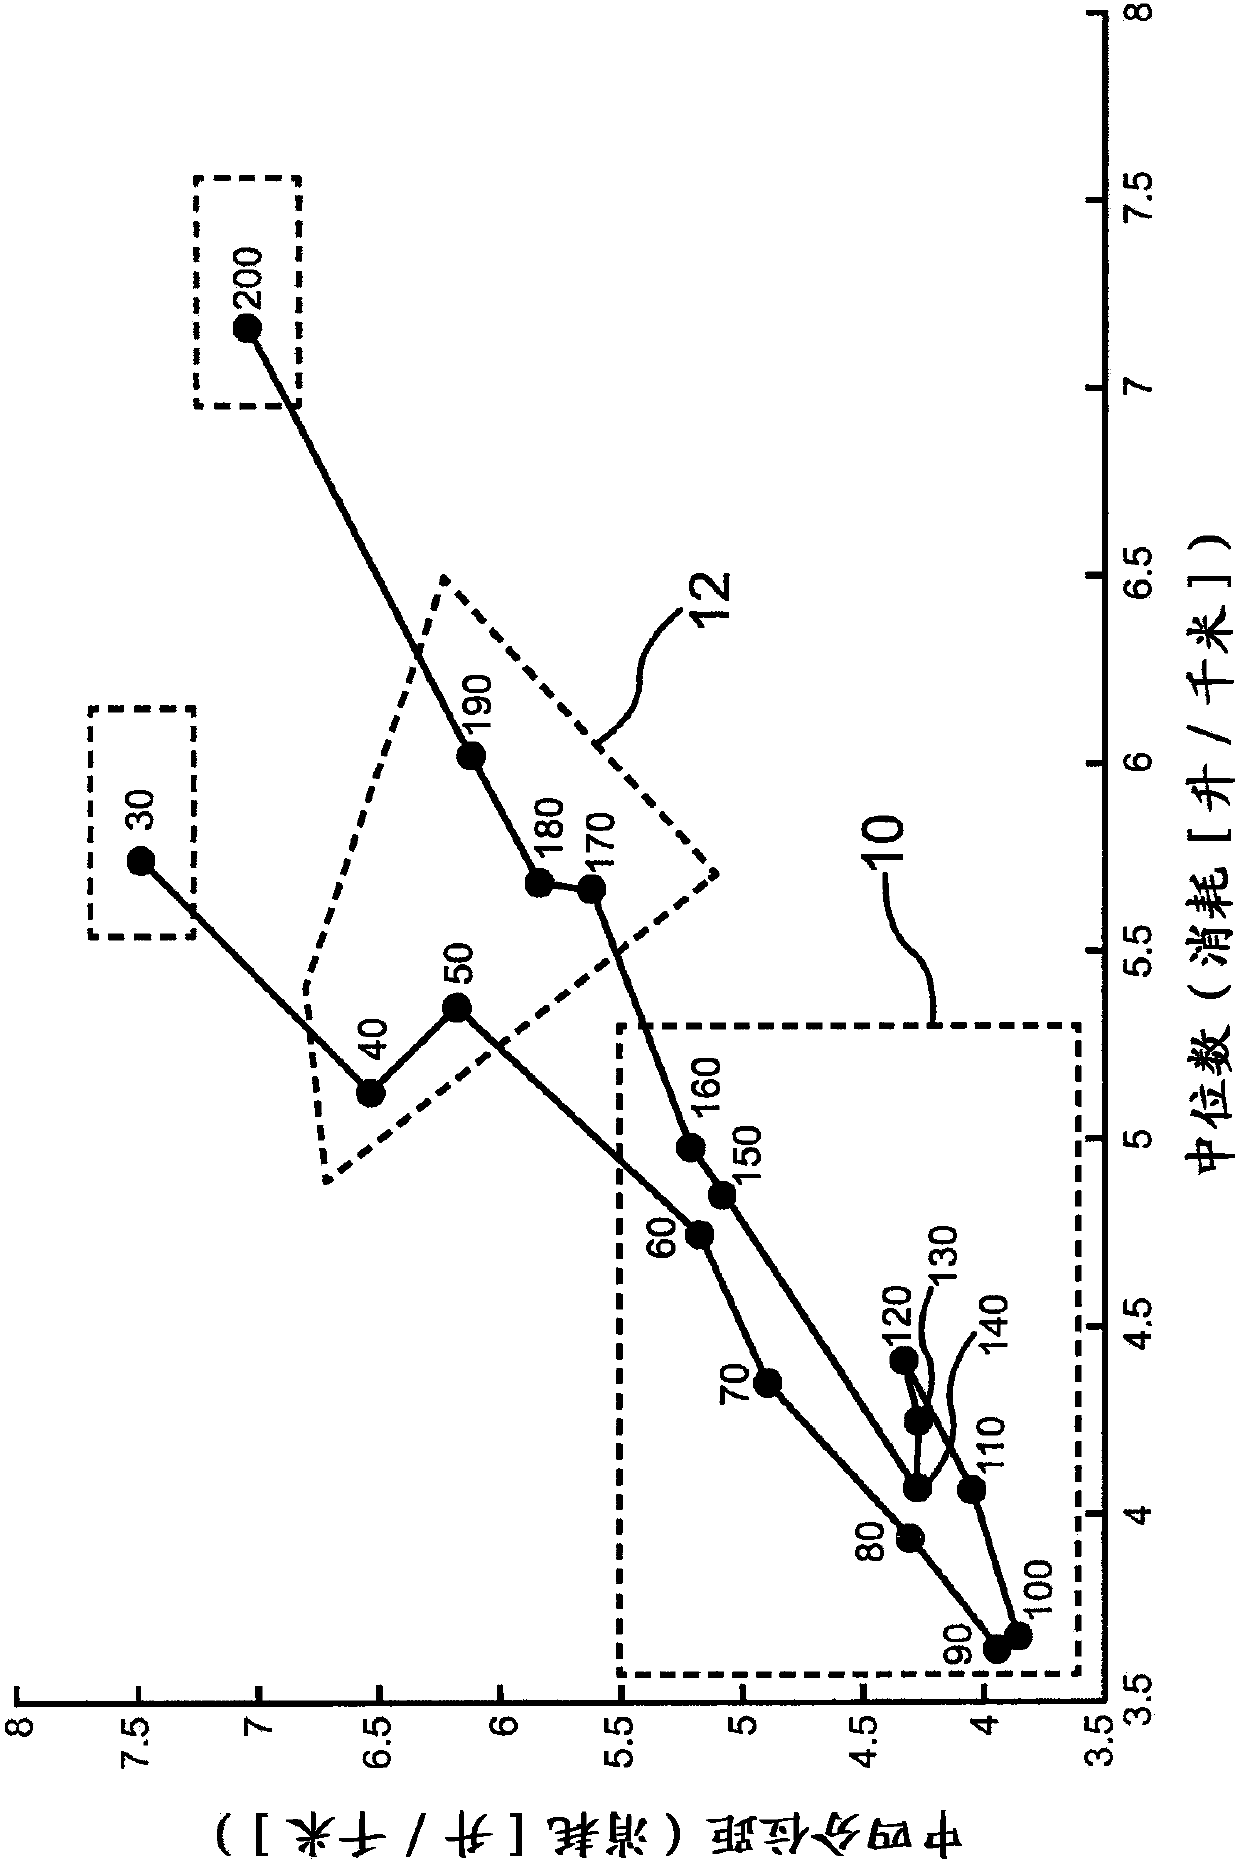
[0023] In order to analyze the consumption of the motor vehicle, a total of 15 million measurement points were recorded over the course of several measurement trips with different vehicle types. Each measuring point is associated here with an instantaneous consumption value of the motor vehicle and is associated with the driving speed prevailing at the moment of measurement. These driving speeds are classified here with a band width of 10 km / h.

[0024] The figures show the statistical evaluation of these measurements. figure 1 The median bar graph plots the median consumption and the median interquartile range for each speed class. figure 2 The same data set is shown, with points in a scatter plot of median consumption versus median interquartile range plotted for each speed class.

[0025] It can be seen that there are sets of speed classes with consumption values ​​that are close to each other. this is in figure 2 particularly evident in . In addition to the distribu...


PUM


Abstract

A method for determining an expected consumption value of a motor vehicle for a predetermined driving situation—includes detecting actual consumption values and storing these values upon each occurrence of the predetermined driving situation, and further estimating the expected consumption value on the basis of the stored consumption values. Furthermore, a check is made whether the expected consumption value satisfies a predetermined significance criterion. If this is the case, the expected consumption value is used for a range determination for the motor vehicle; if this is not the case, an estimated value for the expected consumption is determined and used for range determination for the motor vehicle.

Description

technical field [0001] The invention relates to a method for determining an expected consumption value of a motor vehicle. Background technique [0002] In order to determine the maximum possible driving range of a motor vehicle, the amount of remaining residual energy—that is, the amount of fuel in a motor vehicle with an internal combustion engine or the energy stored in the battery of an electric motor vehicle—is usually compared with the Segment-specific cost division. Since the consumption values ​​of the motor vehicle fluctuate greatly depending on the driving situation, it is inappropriate here to rely only on the currently measured consumption values. For calculation purposes, therefore, the average consumption value is usually used. [0003] In order to be able to determine the driving range particularly accurately, it is already known to use consumption values ​​which depend on the driving situation for calculating the possible driving range. For this purpose, t...

Claims


Application Information

Patent Timeline
Patent Type & Authority Applications(China)
IPC IPC(8): G06Q10/06G07C5/00G07C5/08
CPCG06Q10/04G06Q50/30G07C5/008G06Q10/06G07C5/085G06Q50/40
Inventor A·兰普雷希特
Owner AUDI AG
Learn More