Electrochemical bio-sensing test paper, biosensor device and analyte measuring system
An analyte and biological sensing technology, applied in the field of analyte measurement, can solve the problems of increasing operation complexity, noise interference, increasing reaction time, etc., and achieve the effect of reducing measurement complexity, accurate analyte concentration, and shortening measurement time
- Summary
- Abstract
- Description
- Claims
- Application Information
AI Technical Summary
Problems solved by technology
Method used
Image
Examples
Embodiment 1
[0084] Example 1: Hematocrit ratios obtained by stimulating whole blood and plasma specimens with signals of different frequencies, amplitudes and times
[0085] This embodiment provides the sample-AC plus DC offset signal on the electrochemical biosensing test paper, and provides signals of different frequencies, which are respectively 1kHz, 2kHz, 3kHz, 4kHz, and provides different amplitudes of 0.5Vpp, 0.5Vpp, 1Vpp, 1.5Vpp, and use whole blood and plasma samples respectively, and then measure the current values at different time points of 5 seconds and 10 seconds respectively, and obtain the blood volume ratio through calculation, the results are as follows Figure 7 and Figure 8 shown.
[0086] Please refer to Figure 7 As shown, the left point is the whole blood sample, and the right point is the plasma sample. After providing AC signals with different frequencies and different amplitudes, and measuring the current value obtained after 5 seconds, and comparing the who...
Embodiment 2
[0088] Embodiment 2: Carrying out the correlation test of current value and hematocrit ratio
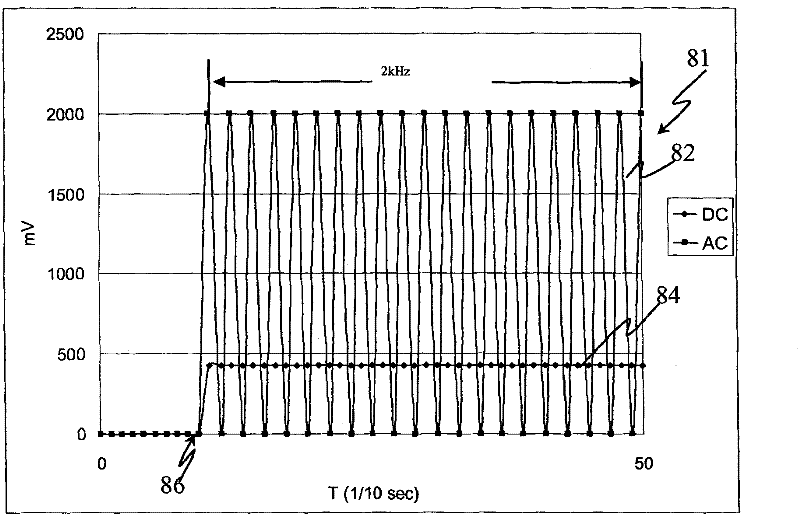
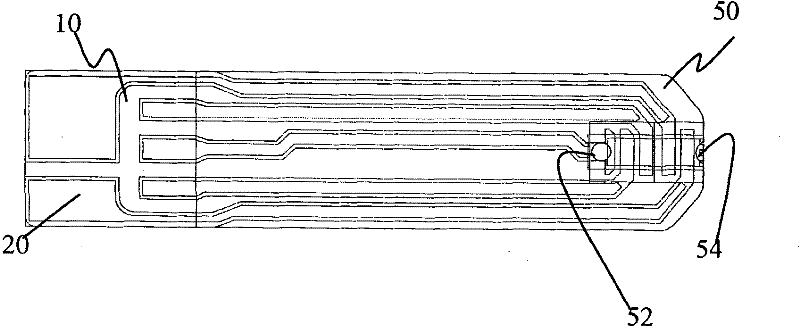
[0089] use as figure 2 The shown electrochemical biosensing test paper is tested, and the present embodiment provides an AC plus DC offset signal for the specimen of the electrochemical biosensing test paper. The frequency provided by the signal is 2kHz, and the amplitude provided is 1Vpp, and Samples with different hematocrit ratios were used respectively, and the current value after 5 seconds was measured, repeated three times, and the correlation with the corresponding hematocrit ratio was compared. The results are as follows: Figure 9 shown.
[0090] refer to Figure 9 As shown, the correlation curve between the current value and the blood volume ratio can be obtained by plotting the current value and the blood volume ratio obtained by three repetitions of the same sample and different samples.
Embodiment 3
[0091] Example 3: Hematocrit ratio calculated by using the electrochemical biosensing test paper with both the first group and the second group of electrodes covering the reaction layer
[0092] This example uses something like figure 2 The structure of the electrochemical biosensing test paper shown is tested, but the first set of electrodes and the second set of electrodes are designed to cover the reaction layer, and the samples with hematocrit ratios of 0, 20, 45, and 65 are used for testing .
[0093] During the measurement, the appropriate amount of sample is sucked into the reaction layer by capillary phenomenon on the test paper, and a direct current is provided to the first group of electrodes, and a voltage including AC voltage and DC offset is provided on the second group of electrodes, and the measurement time point is current value, and eight repetitions were performed.
[0094] Please refer to Figure 10 As shown, the first group of electrodes and the second ...
PUM
| Property | Measurement | Unit |
|---|---|---|
| strength | aaaaa | aaaaa |
Abstract
Description
Claims
Application Information
 - R&D
- Intellectual Property
- Life Sciences
- Materials
- Tech Scout
- Unparalleled Data Quality
- Higher Quality Content
- 60% Fewer Hallucinations
Browse by: Latest US Patents, China's latest patents, Technical Efficacy Thesaurus, Application Domain, Technology Topic, Popular Technical Reports.
© 2025 PatSnap. All rights reserved.Legal|Privacy policy|Modern Slavery Act Transparency Statement|Sitemap|About US| Contact US: help@patsnap.com


