Eureka AIR delivers breakthrough ideas for toughest innovation challenges, trusted by R&D personnel around the world.

Pollution flashover index forecasting method for regional power grid

A technology of regional power grid and prediction method, which is applied in neural learning method, testing dielectric strength, biological neural network model, etc., can solve the problem of inability to comprehensively monitor and predict the power grid in real time, single modeling object, and the distribution of monitoring points of leakage current. Limited scope, etc.

Active Publication Date: 2010-11-24
STATE GRID CORP OF CHINA +1
View PDF5 Cites 37 Cited by
  • Summary
  • Abstract
  • Description
  • Claims
  • Application Information

AI Technical Summary

Problems solved by technology

[0003] Among them, the neural network prediction of equivalent salt density and the support vector machine prediction of pollution flashover voltage all use nonlinear modeling methods to simulate the multidimensional nonlinear relationship between these two parameters describing pollution flashover and environmental meteorological parameters. Combined, this prediction method is in a leading position both at home and abroad, but the two methods still have a single modeling object, and there are certain differences between the established prediction model and its prediction function and the grid anti-pollution work requirements. It has been practically applied in the operation and management of pollution flashover prevention and control. The pollution flashover prediction method based on leakage current has abundant basic data. On this basis, artificial neural network and other methods can be used to obtain a fitting effect that is relatively close to the actual project. However, the leakage current The distribution of monitoring points is limited, and it is impossible to conduct more comprehensive real-time monitoring and prediction of the pollution flashover status of the power grid

Method used


Image

  • Pollution flashover index forecasting method for regional power grid
  • Pollution flashover index forecasting method for regional power grid
  • Pollution flashover index forecasting method for regional power grid

Examples


Embodiment Construction

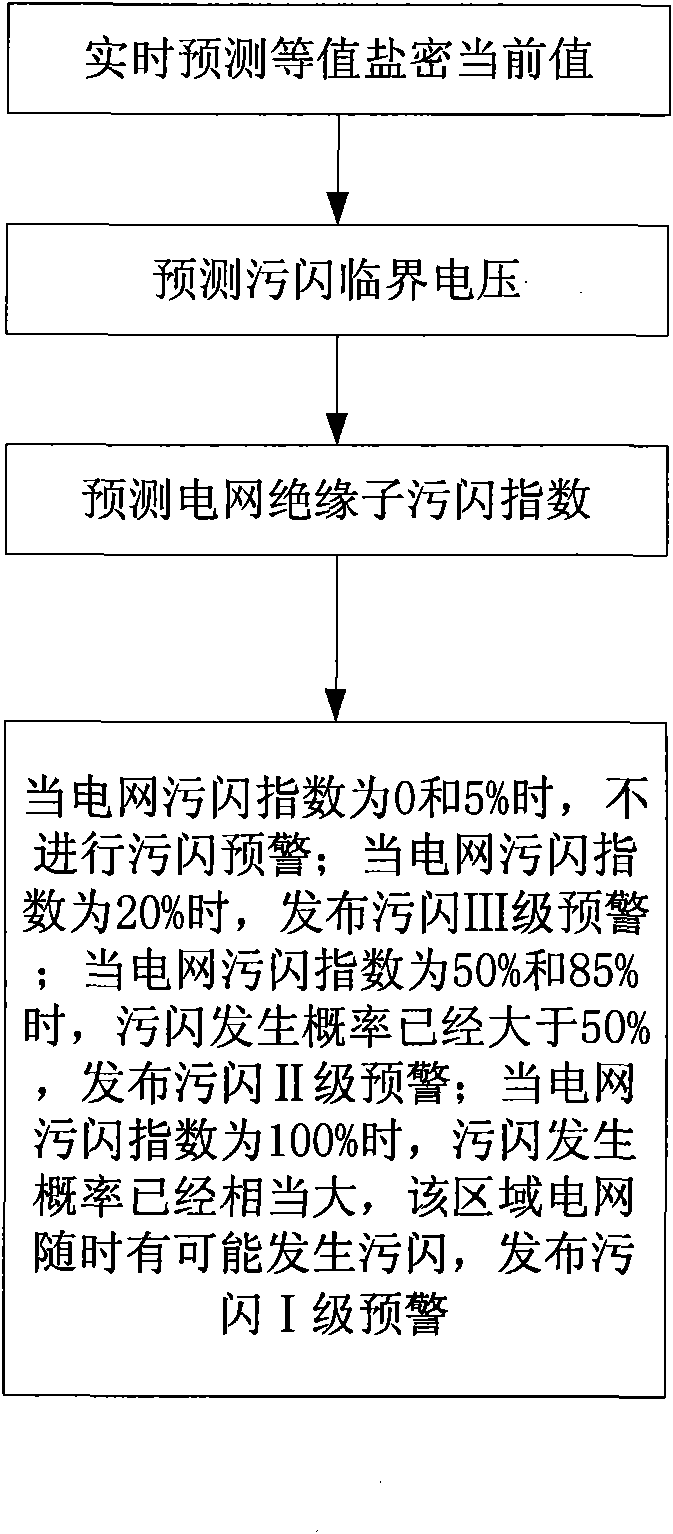
[0079] A method for predicting the pollution flashover index of a regional power grid according to the present invention is described in conjunction with embodiments and accompanying drawings.

[0080] In this method, the steps are as follows, as shown in Figure 1(a):

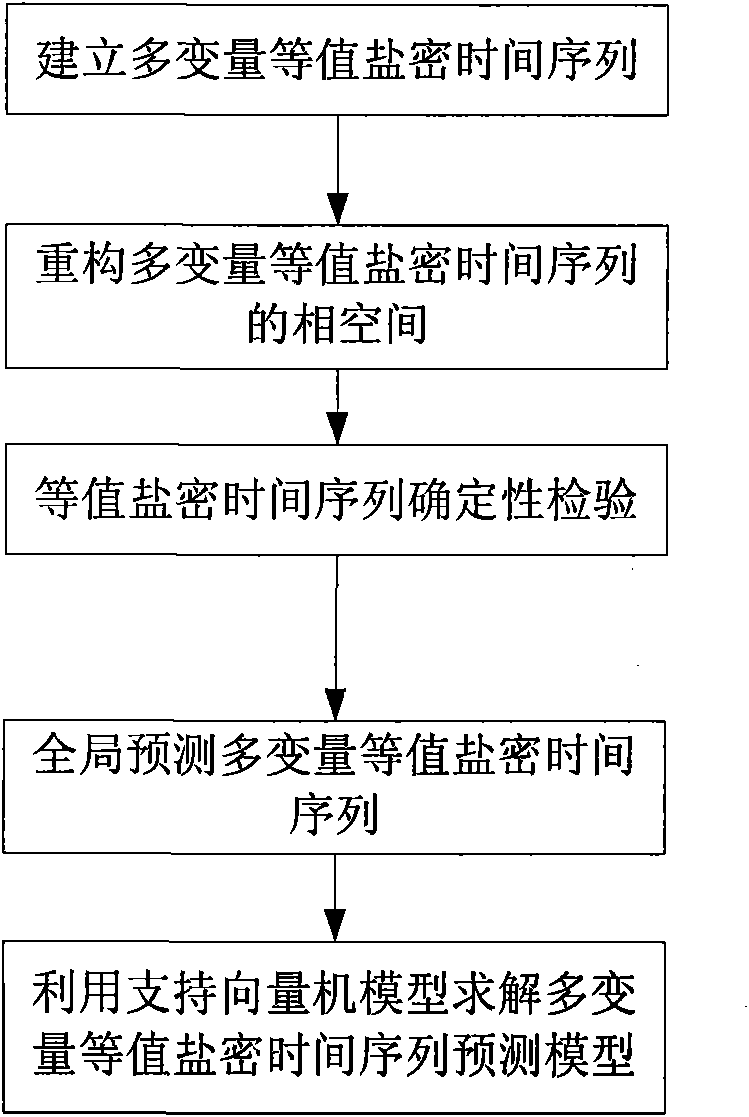
[0081] Step 1. Apply the equivalent salt density prediction model on the surface of the insulator to predict the current value of the equivalent salt density in real time;

[0082] The environmental parameters and equivalent salt density historical values ​​collected on the grid site are input into the insulator surface equivalent salt density prediction model, and the output of the insulator surface equivalent salt density prediction model is the real-time predicted equivalent salt density current value;

[0083] Among them, the environmental parameters collected on site include wind speed, temperature, air pressure, rainfall, humidity and equivalent salt density historical value; wind speed, temperature, air ...


PUM


Abstract

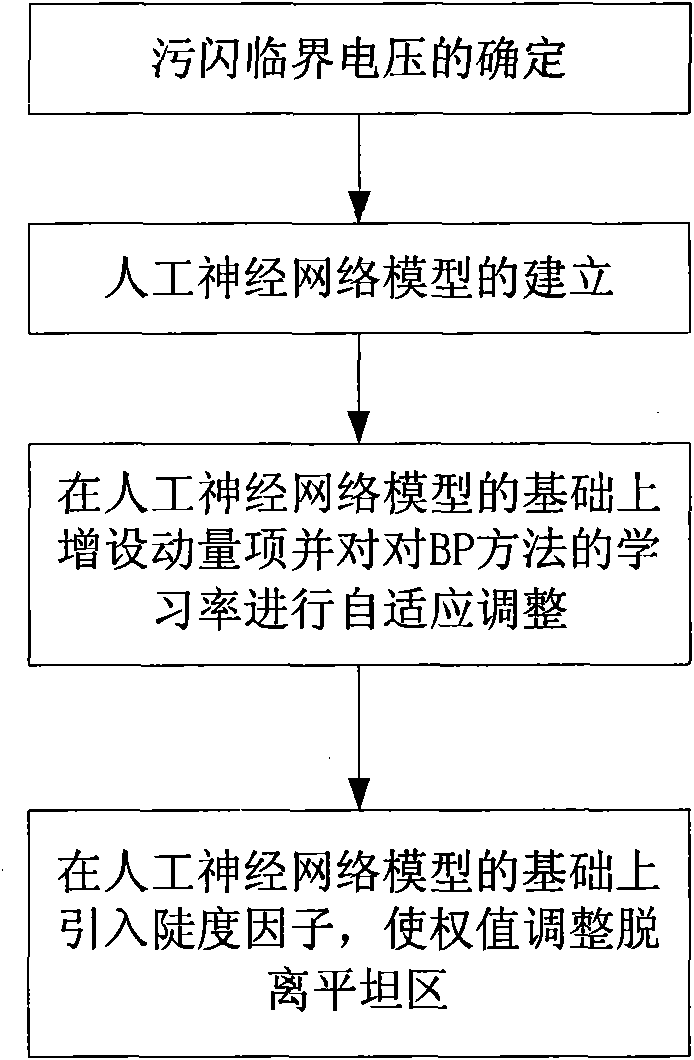
The invention relates to a pollution flashover index forecasting method for a regional power grid, belonging to the technical field of transmission and distribution monitoring. The method of the invention comprises the following steps: (1) forecasting the current value of the equivalent salt deposit density in real time by an insulator surface equivalent salt deposit density forecasting model; (2) forecasting pollution flashover critical voltage by an insulator pollution flashover critical voltage forecasting model; (3) forecasting the insulator pollution flashover index of the power grid by a pollution flashover graded forecasting and prewarning model; and (4) judging the state. The invention has the advantages of providing a multivariable equivalent salt deposit density time sequence forecasting model based on phase space reconstruction, solving by a supporting vector machine model, solving the forecasting problem under the conditions of small sample of equivalent salt deposit density data and noise, and improving the forecasting prediction.

Description

technical field [0001] The invention belongs to the technical field of power transmission and distribution monitoring, and in particular relates to a method for predicting pollution flashover index of a regional power grid. Background technique [0002] During the operation of the power grid, the pollution flashover on the surface of the insulator has a very adverse effect on the power supply system. At present, there are many prediction methods for the pollution flashover on the insulator surface, mainly focusing on the prediction of the equivalent salt density on the surface of the insulator, the insulator Prediction of pollution flashover voltage and pollution flashover prediction based on leakage current. [0003] Among them, the neural network prediction of equivalent salt density and the support vector machine prediction of pollution flashover voltage all use nonlinear modeling methods to simulate the multidimensional nonlinear relationship between these two parameters...

Claims


Application Information

Patent Timeline
Patent Type & Authority Applications(China)
IPC IPC(8): G01R31/08G01R31/12G06N3/08
Inventor 滕云徐建源林莘苏蔚李永祥
Owner STATE GRID CORP OF CHINA
Why Eureka
Eureka Blog
Learn More