
Electrocardiosignal R peak detection method based on waveform characteristic matching

A technology of electrocardiographic signal and waveform characteristics, applied in the field of automatic detection and analysis of electrocardiographic signals, can solve problems such as inability to effectively distinguish, failure of wavelet transform modulus maximum detection method, and influence on the detection accuracy of R wave peaks in electrocardiographic signals , to achieve the effect of simplifying data calculation and improving robustness

Inactive Publication Date: 2010-09-15
CHONGQING UNIV
View PDF1 Cites 31 Cited by
  • Summary
  • Abstract
  • Description
  • Claims
  • Application Information

AI Technical Summary

Problems solved by technology

However, the wavelet transform modulus maximum detection method is powerless in many cases. For example, when there is interference with high frequency and large amplitude, the wavelet transform modulus maximum detection cannot effectively distinguish the band as R wave. It is still interference; when the interference lasts for a relatively long time rather than within a few beats, the wavelet transform modulus maximum detection will also judge the interference with frequency and amplitude equivalent to the R wave as the R wave
These interferences will invalidate the wavelet transform modulus maximum detection method, thereby affecting the detection accuracy of the R peak in the ECG signal

Method used


Image

  • Electrocardiosignal R peak detection method based on waveform characteristic matching
  • Electrocardiosignal R peak detection method based on waveform characteristic matching
  • Electrocardiosignal R peak detection method based on waveform characteristic matching

Examples


Embodiment 1

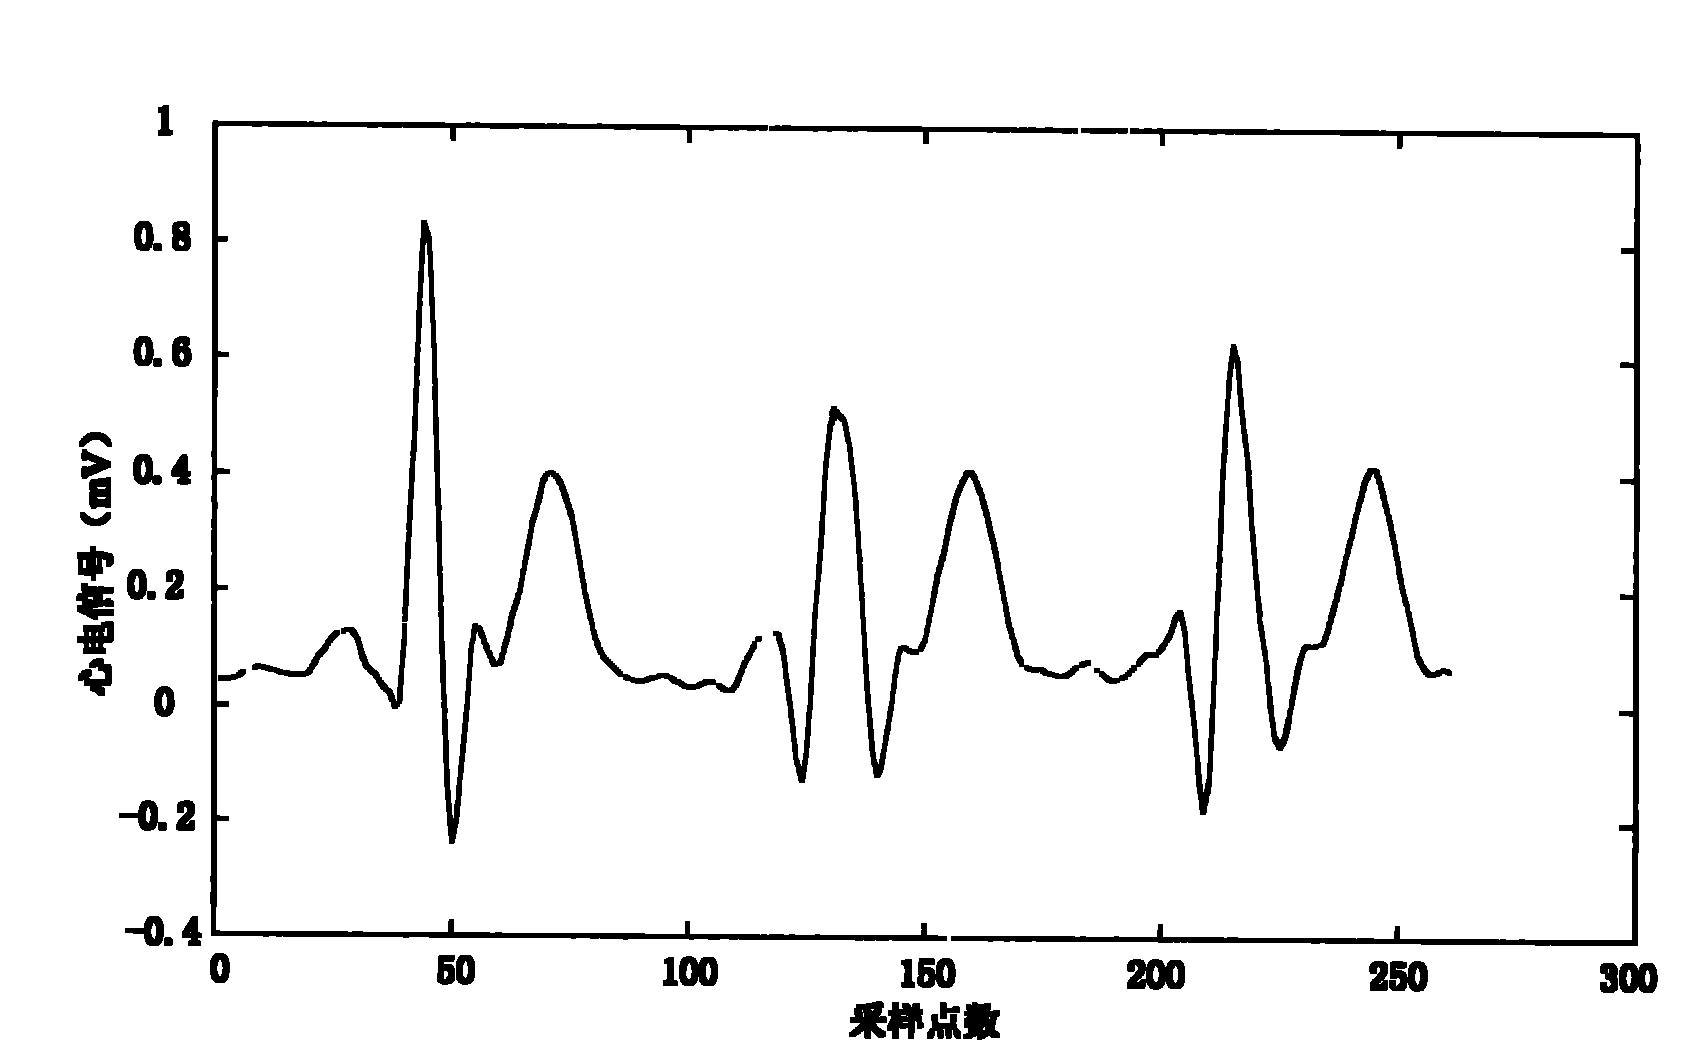
[0102] In this embodiment, the electrocardiogram detector (ECG-9130P, Futian company, Japan) collects electrocardiographic signals, and these signals are digital signals with a sampling frequency of 500 Hz, and these signals are input into a computer for low-pass filtering and sampling preprocessing , the filter uses a second-order Butterworth low-pass filter, the cut-off frequency is 100Hz, and the sampling frequency is 250Hz, and the obtained signal is used as the signal to be tested. The ECG signal to be tested in one of the II leads Its waveform profile is as Figure 9 Shown; Utilize the method of the present invention, identify the ECG signal to be measured R peak in . In the computer, the specific steps are as follows:

[0103] First, establish a logarithmic polar distribution model, such as Figure 7 As shown, the value radius ξ of logarithmic polar diameter max It is pre-set to 10, and M is 10, that is, every "1" logarithmic polar diameter is divided into an int...

Embodiment 2

[0115] In this embodiment, the electrocardiogram detector (ECG-9130P, Futian company, Japan) collects electrocardiographic signals, and these signals are digital signals with a sampling frequency of 500 Hz, and these signals are input into a computer for low-pass filtering and sampling preprocessing , the filter uses a second-order Butterworth low-pass filter, the cut-off frequency is 100Hz, and the sampling frequency is 250Hz, and the obtained signal is used as the signal to be tested. One of the I-lead ECG signals to be tested The ECG signal to be tested is strongly disturbed, and its waveform is shown in Figure 17 shown. It is quite difficult to identify the R-wave peak in such an electrocardiographic signal using the prior art. Utilize 50 template signals selected in embodiment 1, adopt the inventive method to identify the ECG signal to be measured R wave peak in; Wherein, the establishment of logarithmic polar coordinates distribution model is identical with embodim...


PUM


Abstract

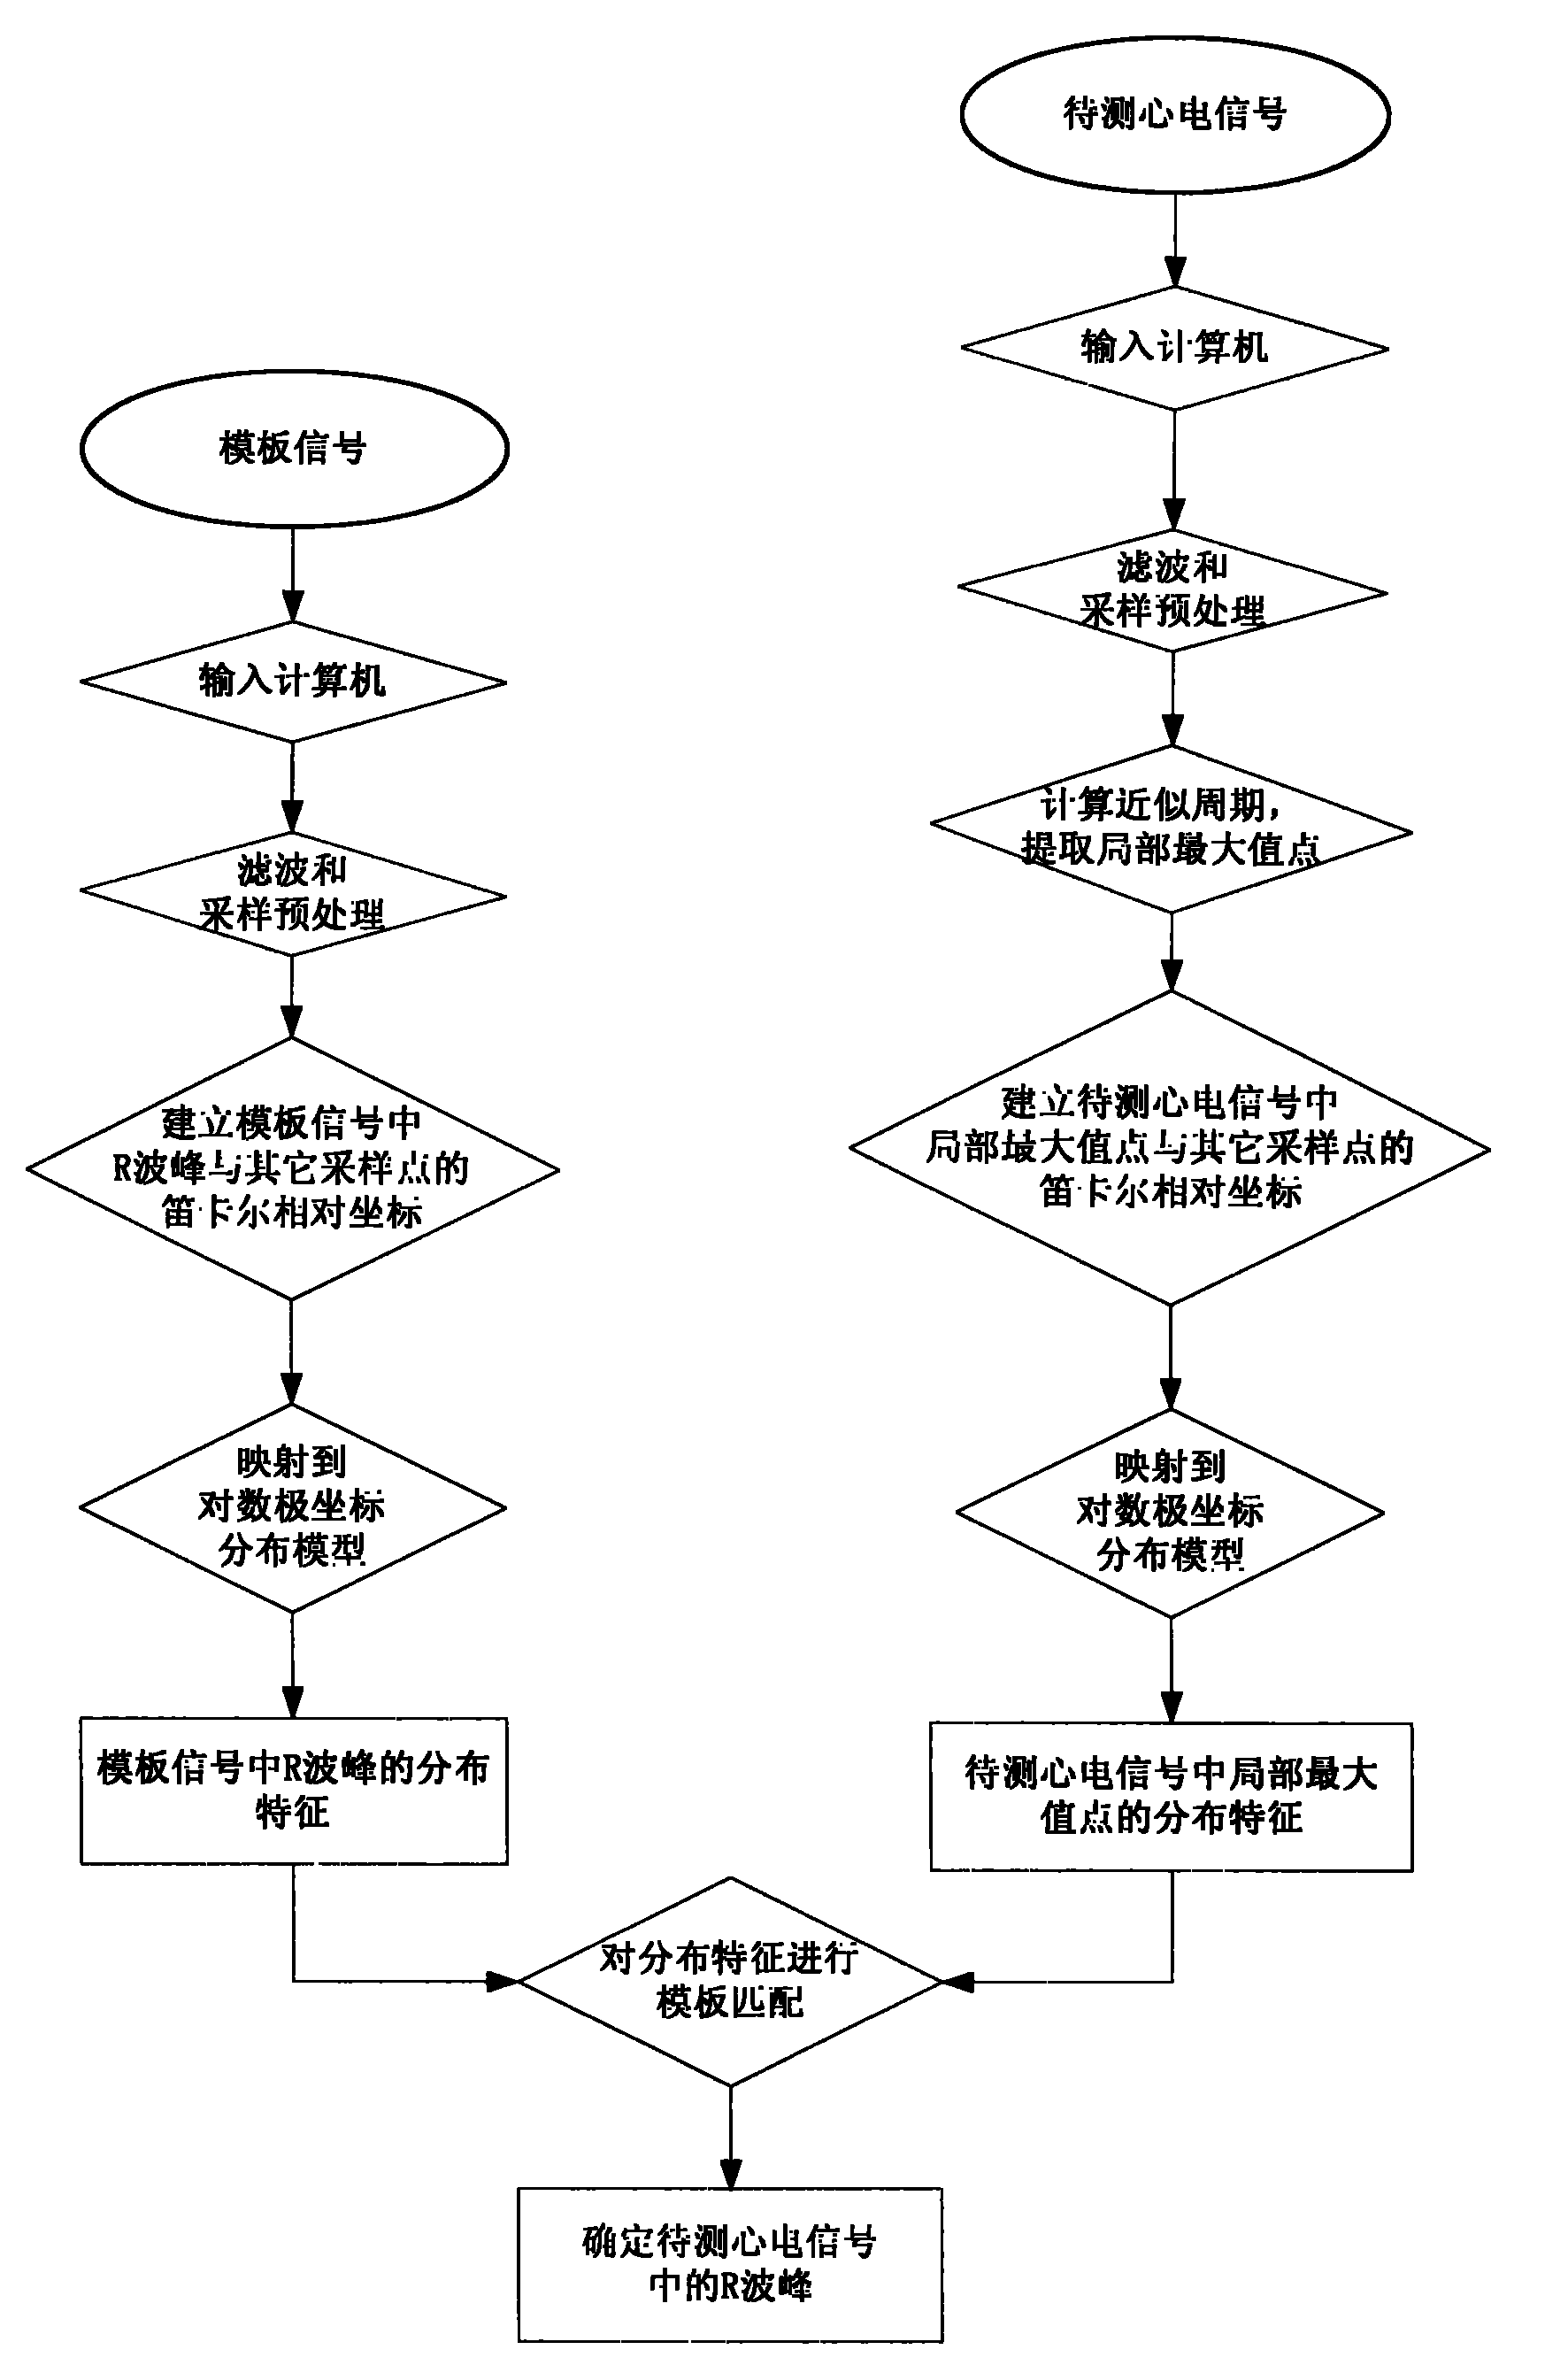
The invention provides an electrocardiosignal R peak detection method based on waveform characteristic matching. The method utilizes waveform characteristic matching to identify R peak of electrocardiosignal, the characteristic matching method takes difference vector between points as basic characteristic, the basic characteristic has translational invariance and rotational invariance and can overcome influence of baseline drift of electrocardiosignal signal; meanwhile, logarithm polar coordinate transformation is carried out on the difference vector and partition is carried out to measure similarity of wave form, the measurement is sensitive to the adjacent morphological characteristic, can capture global outline information of wave form and has robustness to wave form ripple; besides, influence of interference signal can be eliminated by setting proper threshold, and further accurate identification and detection on R peak of electrocardiosignal are realized. The invention is applied to related electrocardiogram analyser, accurate identification on R peak of electrocardiosignal can be realized, thus being beneficial to improving detection and analysis capability of electrocardiogram analysis equipment.

Description

technical field [0001] The invention relates to the technical field of automatic detection and analysis of electrocardiographic signals, in particular to an electrocardiographic signal R-peak detection method for feature extraction and matching of electrocardiographic signals. Background technique [0002] Electrocardiogram (ECG for short) means that in each cardiac cycle, the heart is excited successively by the pacemaker, atria, and ventricles. changing graphics. The electrocardiogram is an objective indicator of the occurrence, propagation and recovery process of cardiac excitement. The QRS complex wave is an important feature of the ECG signal, and it is also the most basic problem in the detection of the ECG signal. It is not only the most important basis for diagnosing arrhythmia, but also other details of the ECG signal can only be analyzed after the QRS complex wave is determined. , for more information. If the QRS complex wave detection is inaccurate, it will gre...

Claims


Application Information

Patent Timeline
Patent Type & Authority Applications(China)
IPC IPC(8): A61B5/0456A61B5/352
Inventor 赵明玺杨力彭承琳
Owner CHONGQING UNIV
Learn More