Bode plot for starting-stopping process analysis

A process analysis, starting and stopping technology, applied in the field of Bode diagrams, can solve problems such as differences in Bode diagrams, inconvenient establishment of Bode diagrams, and incomplete information

Inactive Publication Date: 2009-09-09
NANJING UNIV
View PDF0 Cites 2 Cited by
  • Summary
  • Abstract
  • Description
  • Claims
  • Application Information

AI Technical Summary

Problems solved by technology

The disadvantages of the traditional Bode diagram used for the analysis of the start-stop process are: (1) A Bode diagram is only made by signals in one direction, and the information is not comprehensive, and it can only reflect the change of the vibration characteristics of the shaft in one direction with the speed. From the Bode diagram, we can’t see the changes of the maximum vibration value and the maximum vibration direction of the shaft in the entire support section, and this is precisely what the user cares about most; (2) Determine the peak-to-peak value and peak value of the vibration from the time-domain waveform of the signal sequence There will be some errors in the two parameters of the phase due to the influence of noise and interference; (3) The installation orientation of the two mutually perpendicular sensors on the cross-section changes (such as by the attached figure 2 becomes attached image 3 ), even if the state of the same start-stop process is the same, the Bode diagram will show differences, which is not convenient to establish the relationship between the Bode diagram and the machine state

Method used


Image

  • Bode plot for starting-stopping process analysis
  • Bode plot for starting-stopping process analysis
  • Bode plot for starting-stopping process analysis

Examples


specific Embodiment approach

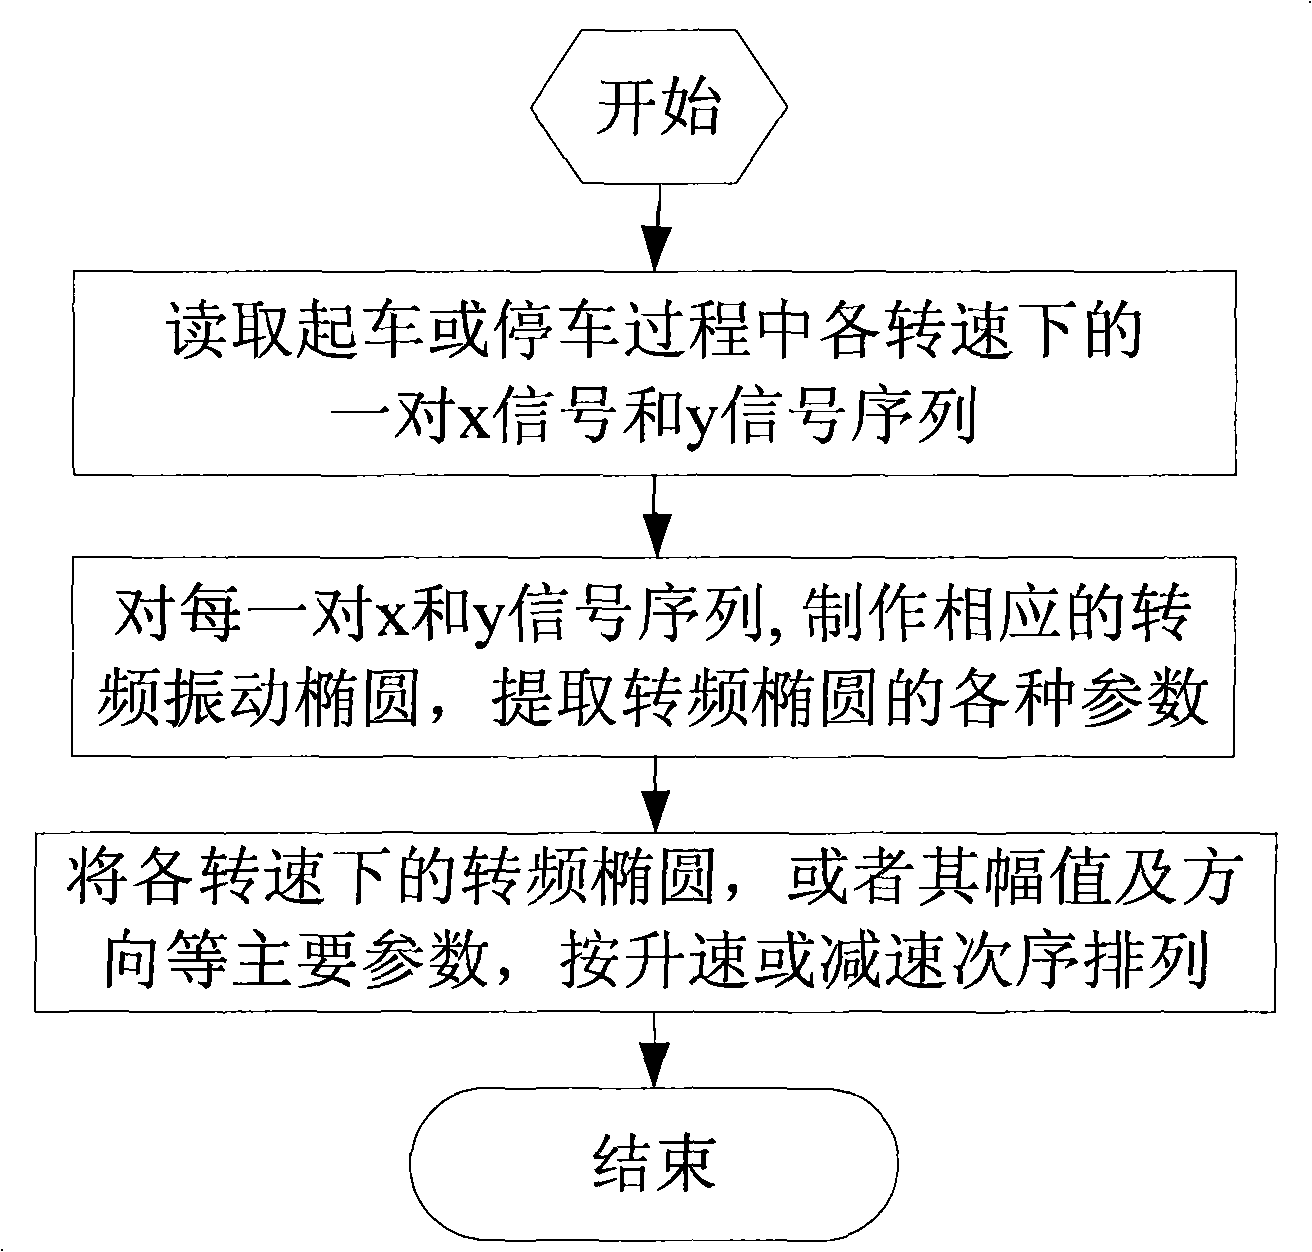
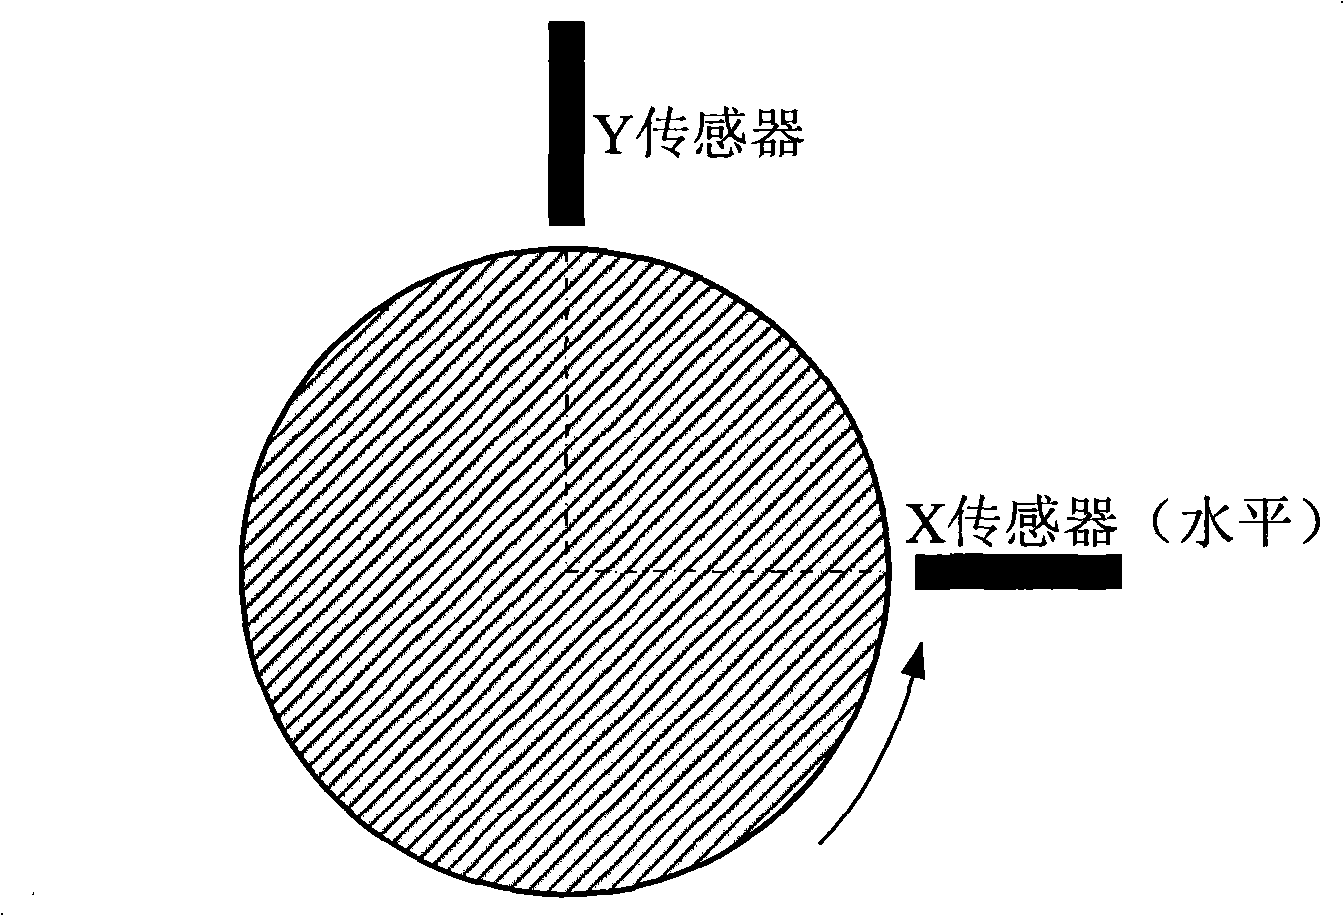
[0038] Simultaneously measure the x and y vibration displacement signal sequences of the rotating shaft at various speeds during the start-up process of a unit. The arrangement of the X and Y sensors is as follows image 3shown. For each pair of x signal and y signal sequences collected synchronously, the sampling rate is 2kHz, and the number of sampling points is N=1024 points. The specific implementation is as follows:

[0039] (1) Read the sequence pair of x signal and y signal at each speed during the starting process, the sampling rate is 2kHz, and the number of sampling points is N=1024.

[0040] (2) Perform fast discrete Fourier transform (FFT) on a pair of x-signal and y-signal sequences at each rotational speed, and the result is a 1024-point complex sequence.

[0041] (3) Based on the fast Fourier transform results of the two signals of x and y, obtain their respective Fourier series, and obtain parameters of a total of N / 2=512 harmonic components from small to lar...


PUM


Abstract

The invention relates to a method for making a Bode plot for starting-stopping process analysis. The method comprises three steps: (1) reading a pair of vibration displacement arrays, i.e. an x signal array and a y signal array which are collected at each rotation speed in the starting or stopping process; (2) synthesizing and making the corresponding rotation frequency vibration ellipse of the x signal array and the y signal array at each rotation speed and extracting various parameters of the rotation frequency vibration ellipses; and (3) arranging the evaluated rotation frequency vibration ellipse (can accompany with some parameters) at each rotation speed, or the maximum vibration value (amplitude) parameter of the rotation frequency vibration ellipse, or the maximum vibration direction parameter of the rotation frequency vibration ellipse or some other parameters of the rotation frequency vibration ellipse according to the rising speed or reducing speed sequence to form a plot. The Bode plot made by the method can better reflect the change characteristics of the rotation shaft vibration in the starting-stopping process of a machine and equipment.

Description

technical field [0001] The invention relates to a Bode diagram used for analyzing the start-stop process. [0002] For large rotating machines with sliding bearings as rotor supports, such as large motors, centrifugal compressors, etc., an important tool for the analysis of the start and stop process of these devices is the Bode diagram. [0003] Usually, two vibration displacement sensors perpendicular to each other pointing to the center of the rotating shaft are installed at a supporting section of the rotating shaft of the rotating machine, called X sensor and Y sensor, to obtain the vibration displacement signal of the rotating shaft on this section, see the attached diagram for an example figure 2 And attached image 3 The so-called X sensor refers to the particle point on the surface of the rotor that intersects with the horizontal direction in the accompanying drawing, and the sensor that first turns counterclockwise is the X sensor. It may be advisable to refer to t...

Claims


Application Information

Patent Timeline
Patent Type & Authority Applications(China)
IPC IPC(8): G01M19/00G01H1/00G01M99/00
Inventor 刘红星肇莹郑威史瑞超
Owner NANJING UNIV
Why Eureka
Try Eureka