
Facilitating targeted analysis via graph generation based on an influencing parameter

a graph and parameter technology, applied in the field of computational analyses, can solve the problems of affecting the representation of objects in the collection of documents, affecting the explanatory power of the graph, and achieving inferences that would otherwise be impractical,

Active Publication Date: 2017-01-31
QUID LLC
View PDF84 Cites 56 Cited by
  • Summary
  • Abstract
  • Description
  • Claims
  • Application Information

AI Technical Summary

Benefits of technology

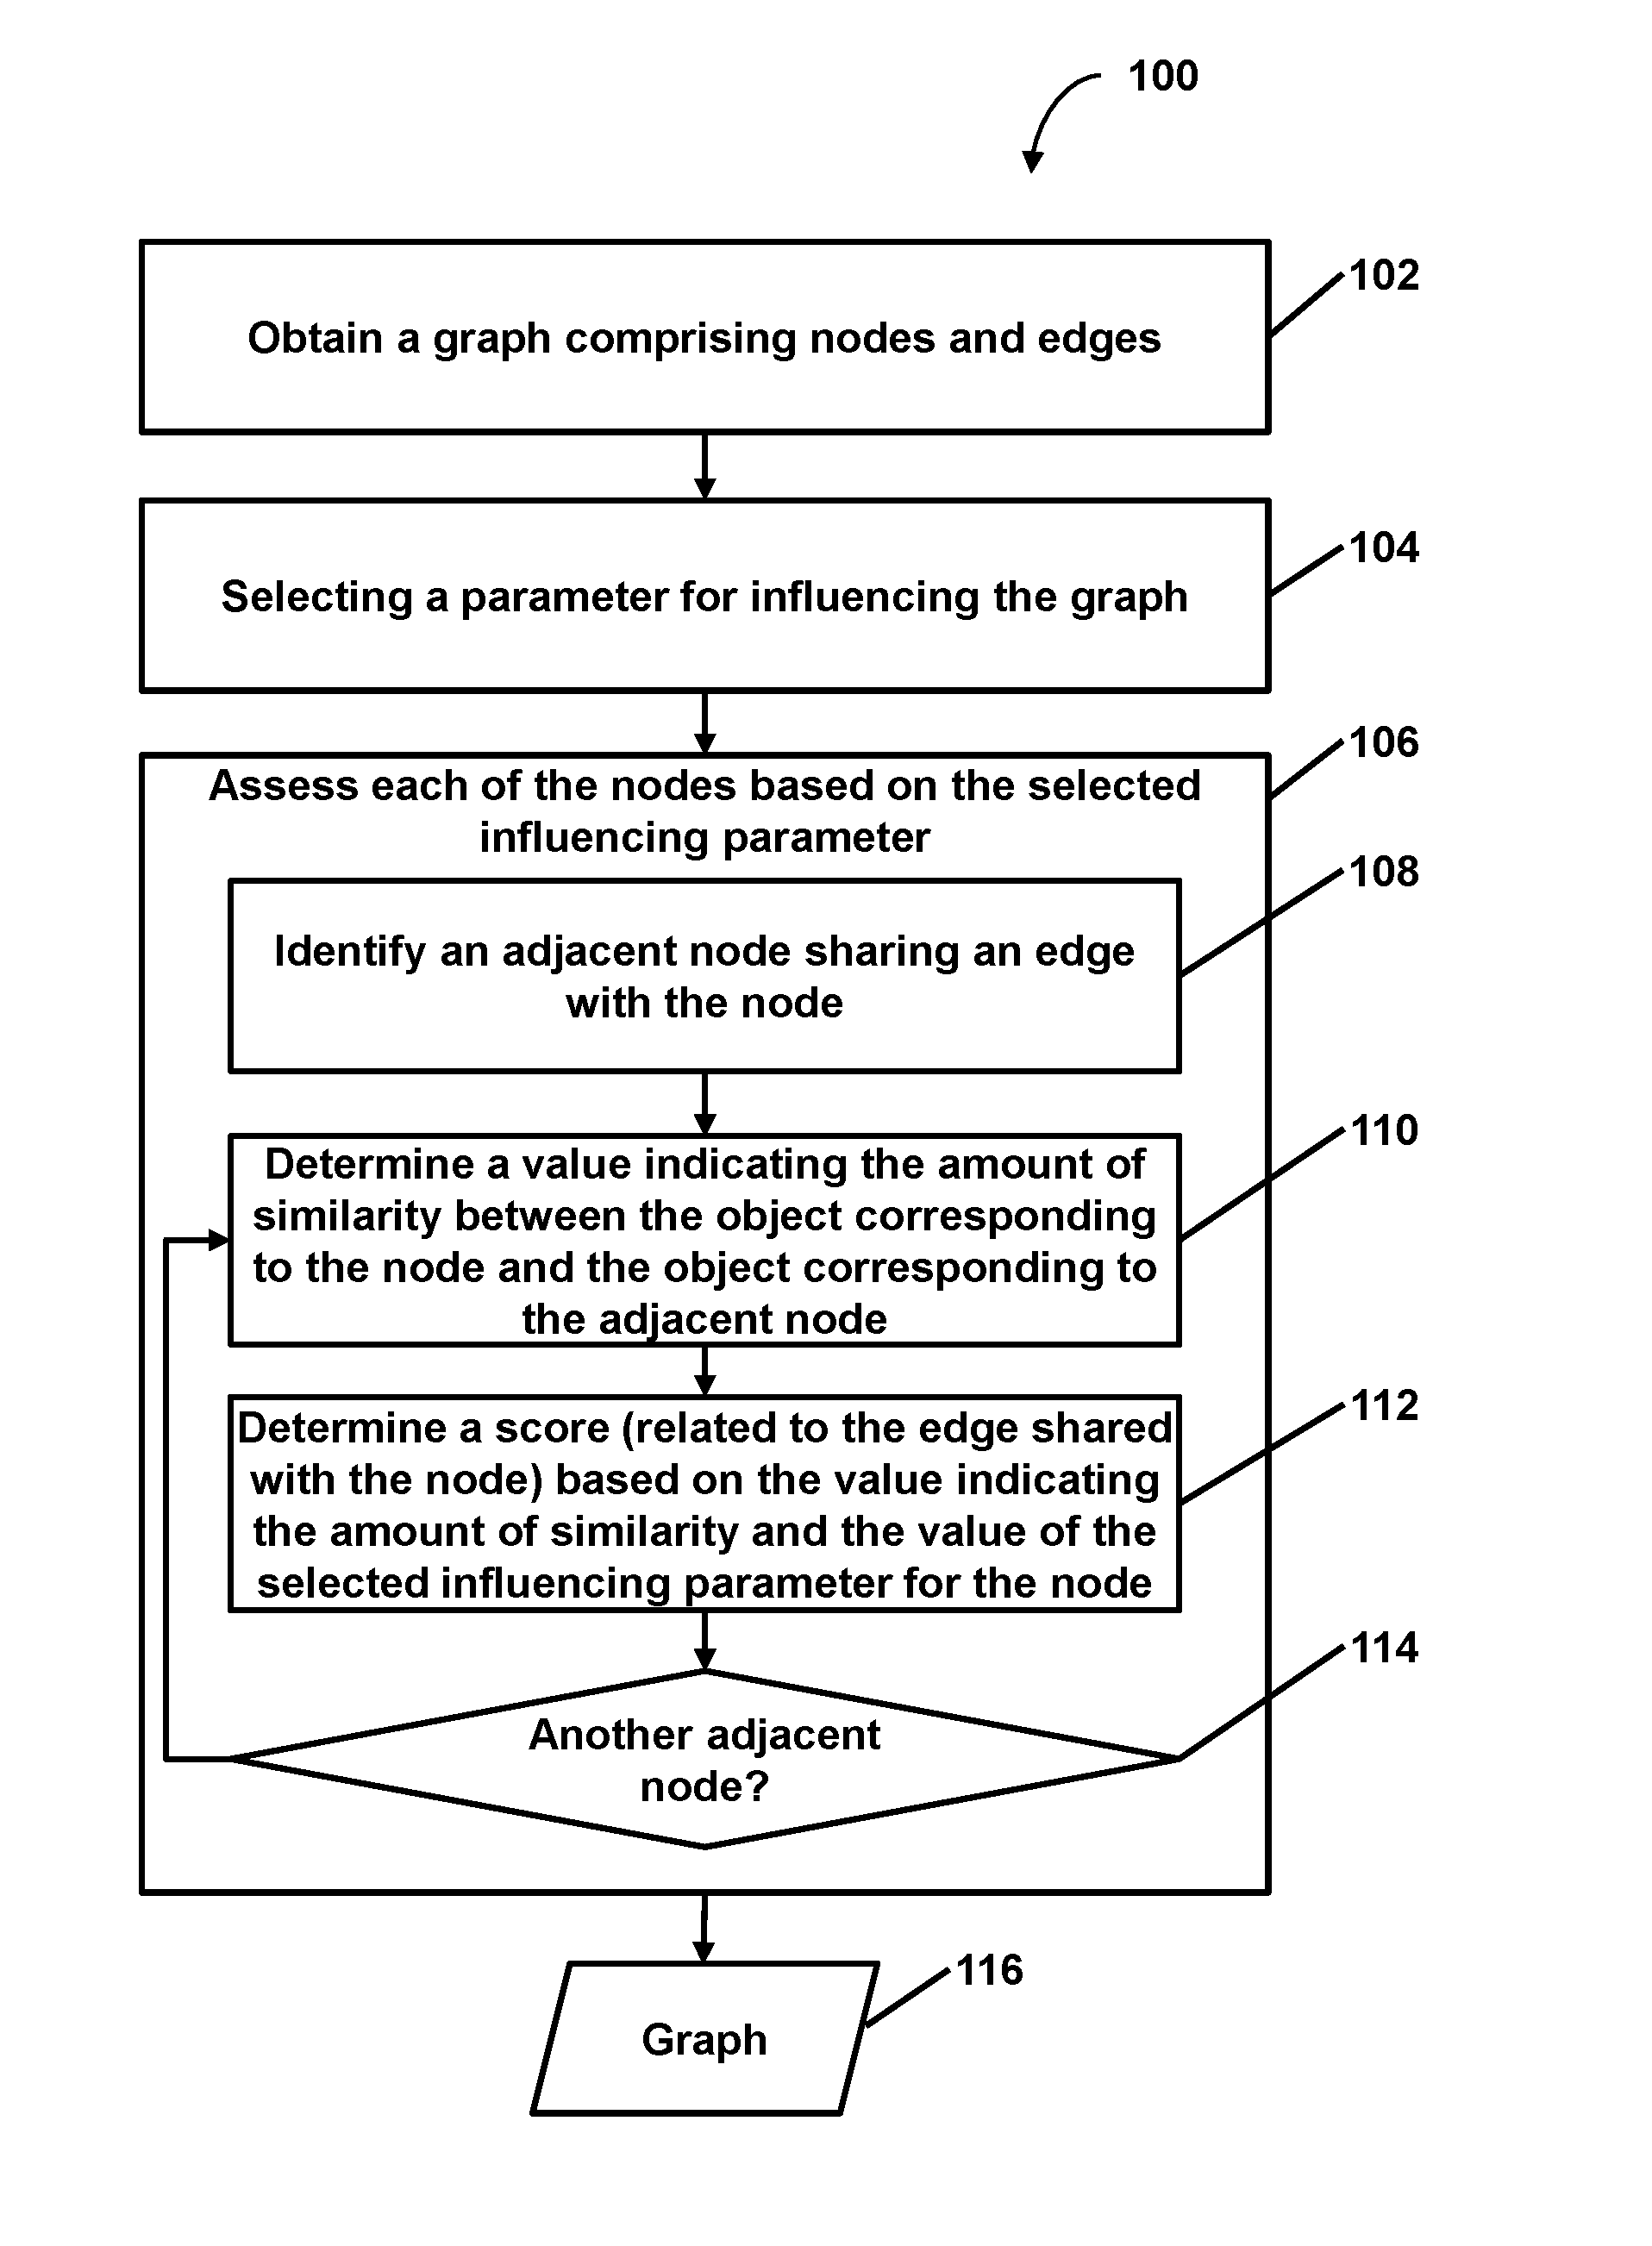
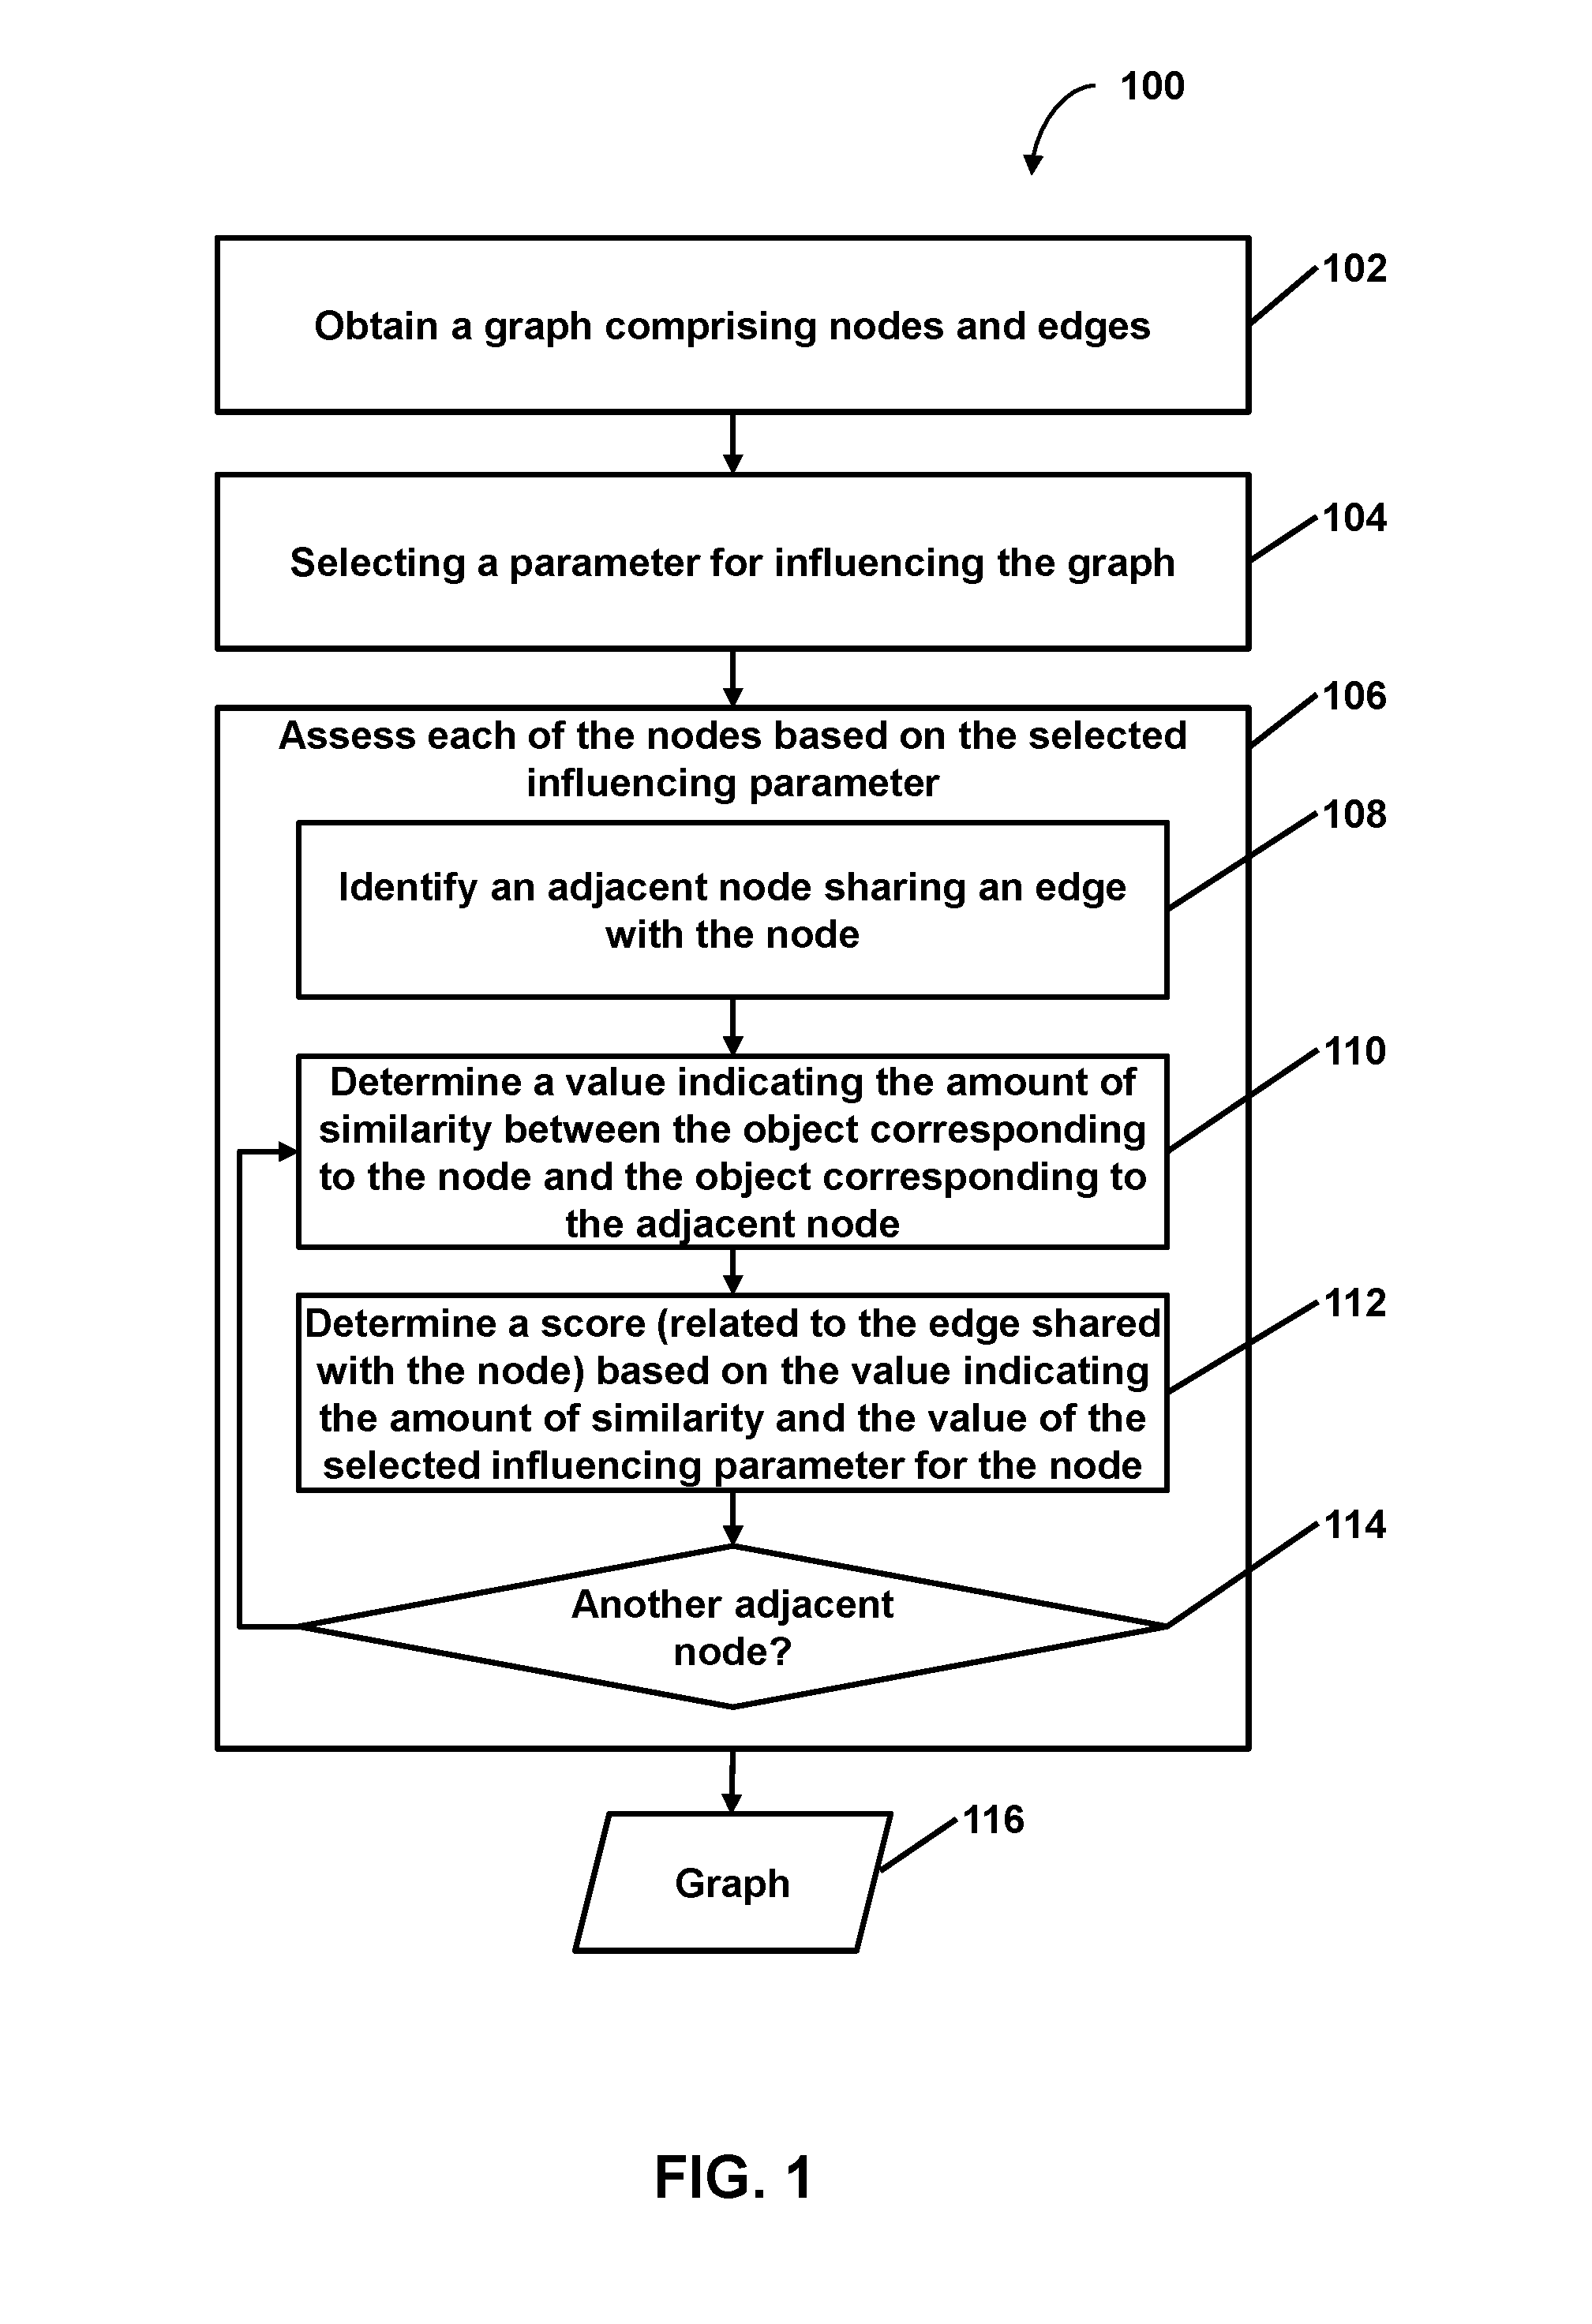
This patent describes a process for creating a graph based on a set of nodes and edges, and then influencing the graph based on certain parameters to determine the similarity between objects. The resulting graph can then be displayed based on the influence parameters and the similarity between objects. The process can be performed using a computer system and can be useful for analyzing complex data sets.

Problems solved by technology

Through the sophisticated use of computers, inferences that would otherwise be impractical are potentially attainable, even on relatively large collections of documents.
In some cases, such influence may undermine the explanatory power of the graph by relegating certain objects to a position more marginal than is appropriate because of a poor description, the use of uncommon words in the text describing the respective objects, etc., in the underlying text.
As a result, misleading text may negatively affect the representation of the objects in the collection of documents.

Method used


Image

  • Facilitating targeted analysis via graph generation based on an influencing parameter
  • Facilitating targeted analysis via graph generation based on an influencing parameter
  • Facilitating targeted analysis via graph generation based on an influencing parameter

Examples


embodiment 1

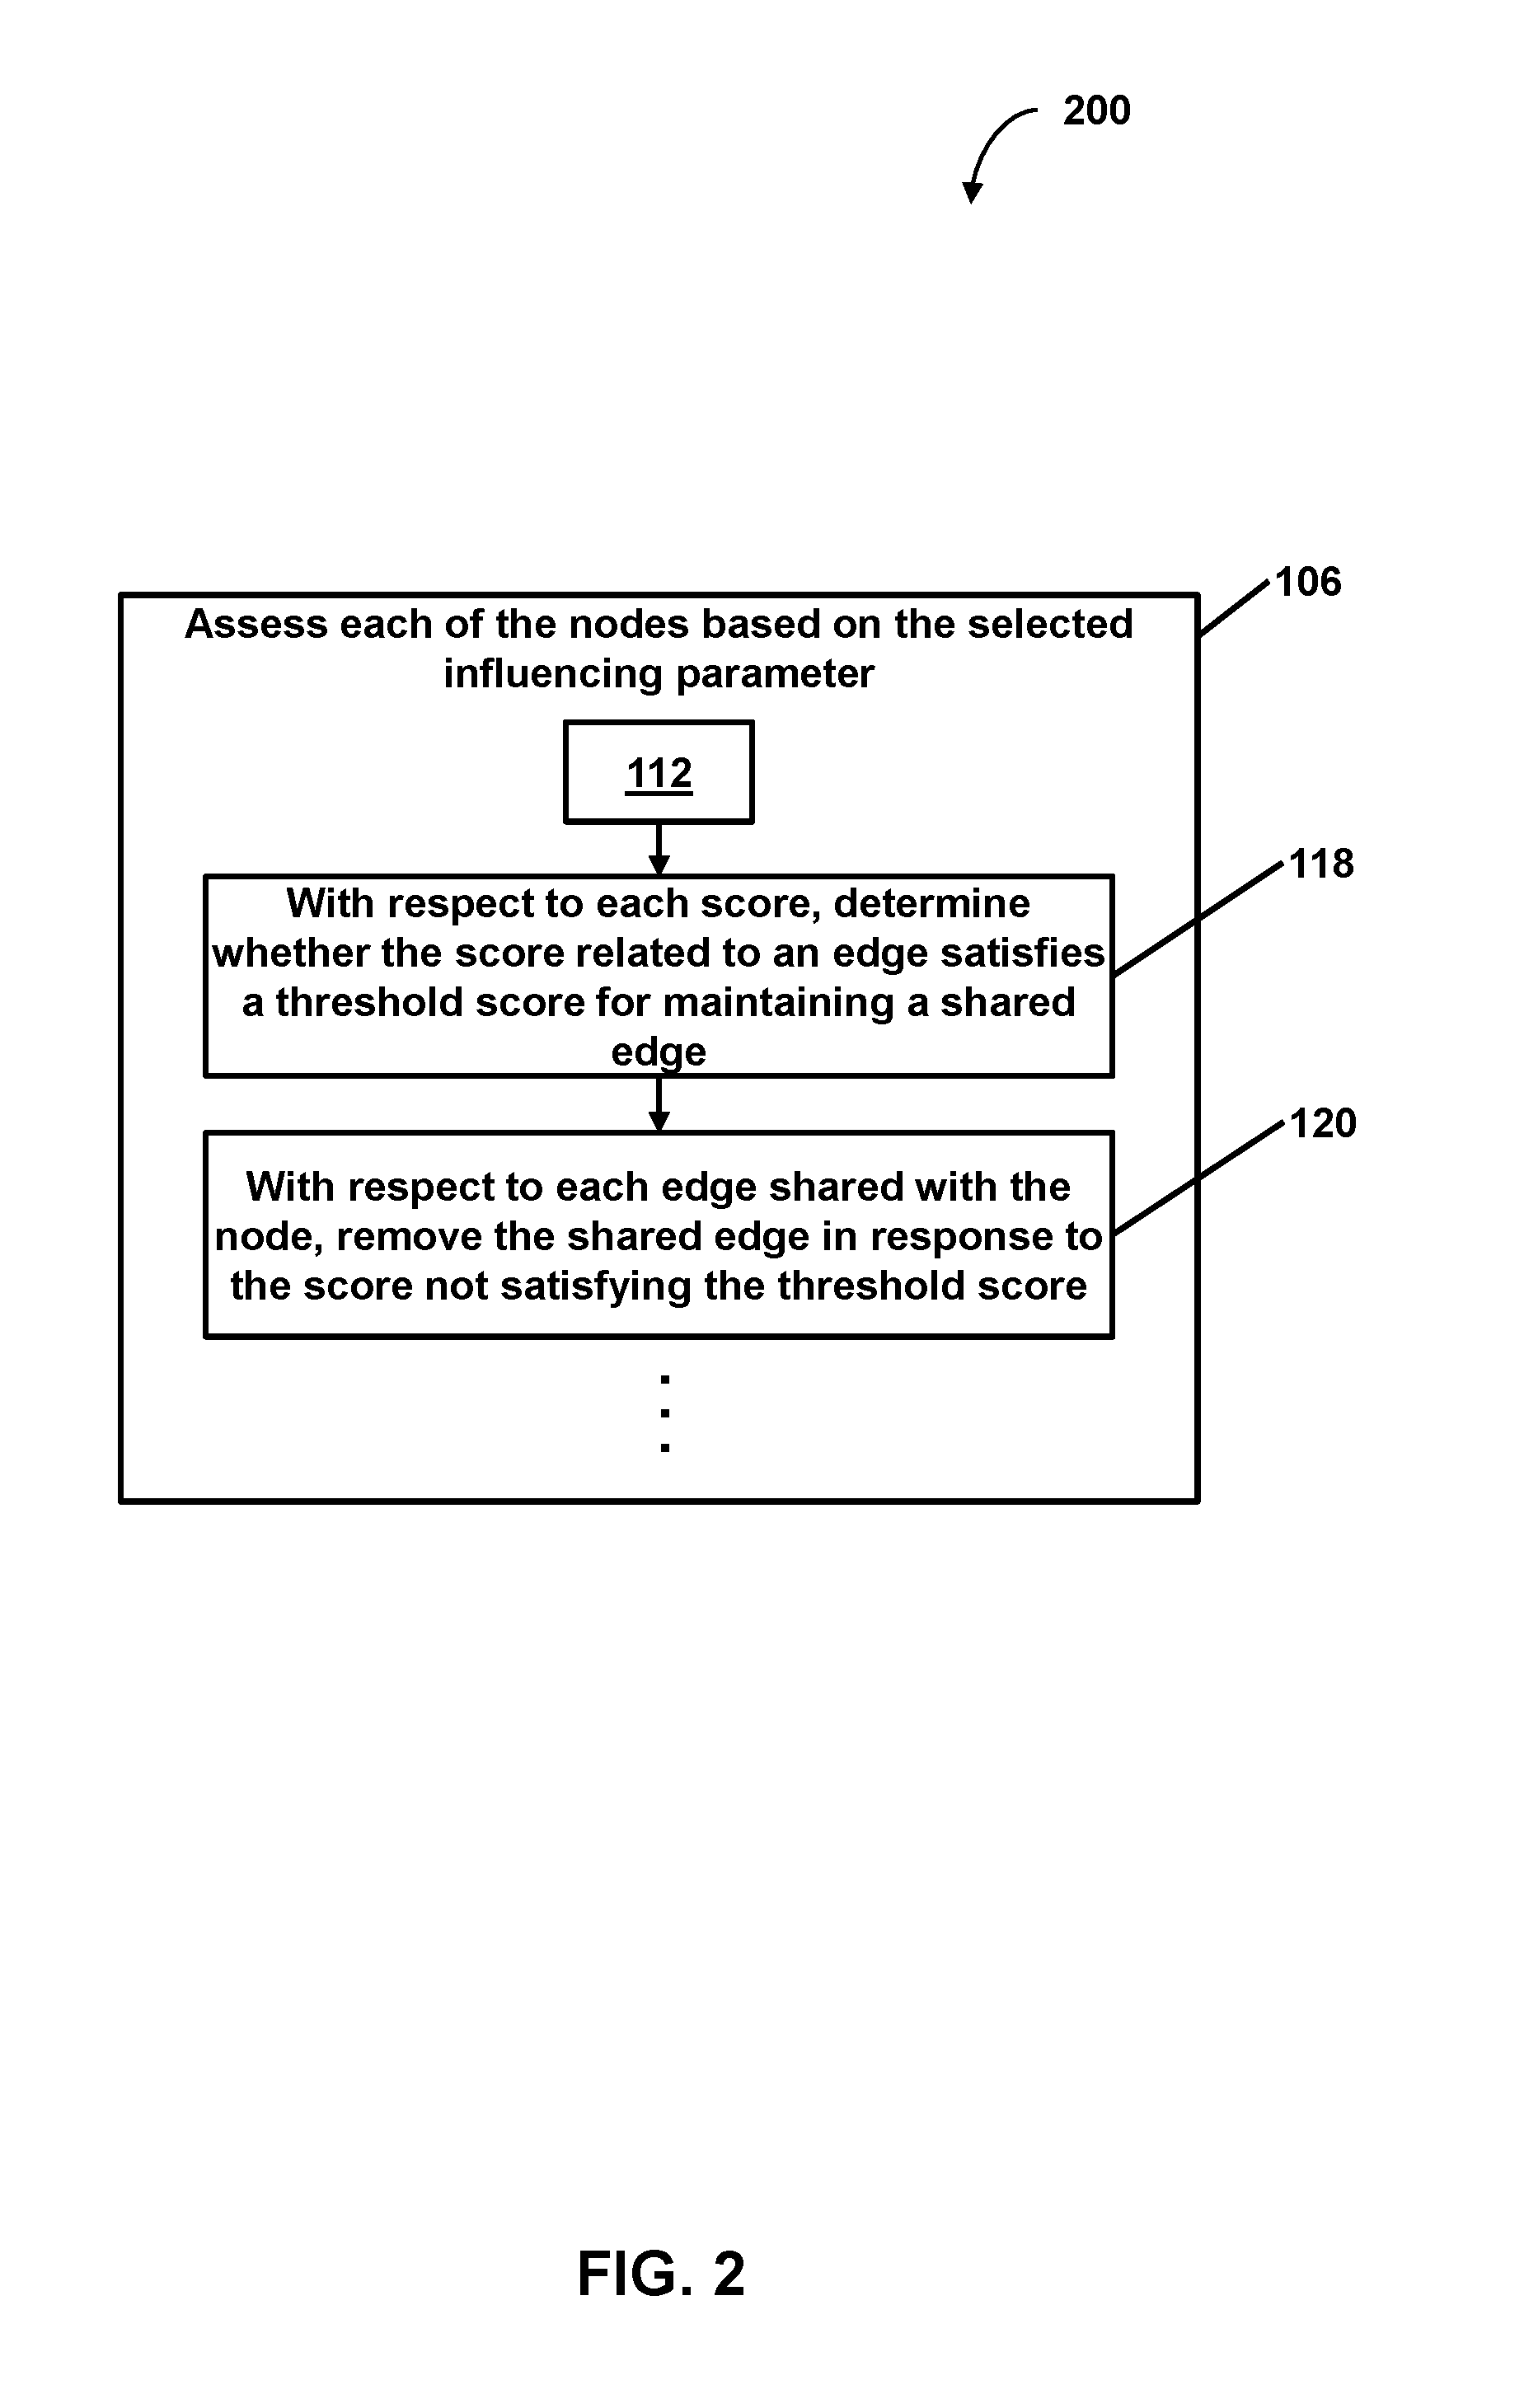
2. The method of embodiment 1, wherein assessing the number of edges comprises, with respect to each of the nodes of the graph that is an adjacent node candidate of the evaluation node: determining a value indicating an amount of similarity between the object corresponding to the evaluation node and the object corresponding to the adjacent node candidate; determining a score related to the adjacent node candidate, the score determined based on the value indicating the amount of similarity and the value of the selected influencing parameter for the evaluation node; determining whether the score satisfies the threshold score for maintaining a shared edge; and adding an edge linking the evaluation node and the adjacent node candidate based on the score satisfying the threshold score such that the adjacent node candidate is an adjacent node that shares the added edge with the evaluation node.

3. The method of embodiments 1-2, wherein, with respect to each evaluation node among the nodes ...

embodiment 3

4. The method of embodiment 3, wherein selecting the one or more nodes based on the extracted entity comprises: accessing an index of topics of documents to identify the one or more nodes as nodes that correspond to at least one document about the entity.

5. The method of embodiments 1-4, wherein: the graph comprises a weighted semantic graph of semantic similarity between unstructured text in documents within an analyzed corpus; weights of the semantic graph are inferred by unsupervised learning of the weights by one or more computers; and each of the nodes of the graph correspond to at least one respective document within the analyzed corpus.

embodiment 5

6. The method of embodiment 5, wherein determining the value indicating the amount of similarity between the object corresponding to the evaluation node and the object corresponding to the adjacent node comprises: obtaining a first vector corresponding to the document that corresponds to the evaluation node and a second vector corresponding to the document that corresponds to the adjacent node; determining similarity between the first vector and the second vector; and determining the value indicating the amount of similarity between the document corresponding to the evaluation node and the document corresponding to the adjacent node based on the similarity between the first vector and the second vector.

7. The method of embodiment 5, wherein, with respect to the evaluation node and each adjacent node in the graph sharing an edge with the evaluation node: an n-gram representation of the document corresponding to the evaluation node is obtained and encoded as at least part of a first n...


PUM


Abstract

Provided is a process including: obtaining a graph comprising nodes and edges, each of the edges having a value indicating an amount of similarity between objects corresponding to the two linked nodes; selecting a parameter for influencing the graph; assessing each of the nodes based on the selected influencing parameter, wherein assessing comprises, with respect to each adjacent node in the graph sharing an edge with the node: determining the value indicating the amount of similarity between the object corresponding to the node and the object corresponding to the adjacent node; and determining a score related to the edge shared with the node, the score determined based on the similarity-amount value and a value of the selected influencing parameter for the node, such that edges are removed, weakened, added, or strengthened; and preparing, based on the graph, instructions to display at least part of the graph.

Description

BACKGROUND[0001]1. Field[0002]The present invention relates generally to computational analyses and, more specifically, to facilitating targeted analysis via graph generation based on an influencing parameter.[0003]2. Description of the Related Art[0004]Often people wish to draw inferences based on information contained in, and distributed among, relatively large collections of documents, e.g., substantially more documents than they have time to read or the cognitive capacity to analyze. Certain types of inferences implicate relationships between those documents. For example, it may be useful to organize documents by the subject matter described in the documents, sentiments expressed in the documents, or topics addressed in the documents. In many cases, useful insights can be derived from such organization, for example, discovering taxonomies, ontologies, relationships, or trends that emerge from the analysis. Examples might include organizing restaurants based on restaurant reviews...

Claims


Application Information

Patent Timeline
IPC IPC(8): G06F17/30G06N5/04
CPCG06F17/30696G06N5/048G06F17/30958G06N5/022G06F16/338G06F16/9024G06N20/00G06N5/04
Inventor TACCHI, RUGGERO ALTAIRCIULLA, FABIO
Owner QUID LLC
Learn More