System tools for evaluating operational and financial performance from dispatchers using after the fact analysis

a dispatcher and after-the-fact analysis technology, applied in the field of system tools, can solve the problems of increasing energy consumption, increasing the cost of electric power delivered during periods of peak demand, and increasing the unreliable and antiquated electric power grid itself, so as to and evaluate operational and financial performance.

Active Publication Date: 2017-01-31
ALSTOM TECH LTD
View PDF165 Cites 22 Cited by
  • Summary
  • Abstract
  • Description
  • Claims
  • Application Information

AI Technical Summary

Problems solved by technology

With respect to the electric power grid, expensive peak power—electric power delivered during periods of peak demand—can cost substantially more than off-peak power.
The electric power grid itself has become increasingly unreliable and antiquated, as evidenced by frequent large-scale power outages.
Grid instability wastes energy, both directly and indirectly, for example, by encouraging power consumers to install inefficient forms of backup generation.
Clean forms of energy generation, such as wind and solar, suffer from intermittency.
Hence, grid operators are reluctant to rely heavily on these sources, making it difficult to move away from standard, typically carbon-intensive forms of electricity.
The electric power grid contains limited inherent facility for storing electrical energy.
Electricity must be generated in a balanced fashion to meet uncertain demand, which often results in either over or under commitment or dispatch of generation, hence system inefficiency, system insecurity and power failures.
However, current power services infrastructure lacks provisioning and flexibility that are required for aggregating a large number of small-scale resources (e.g., electric vehicle batteries) to meet medium- and large-scale needs of power services.
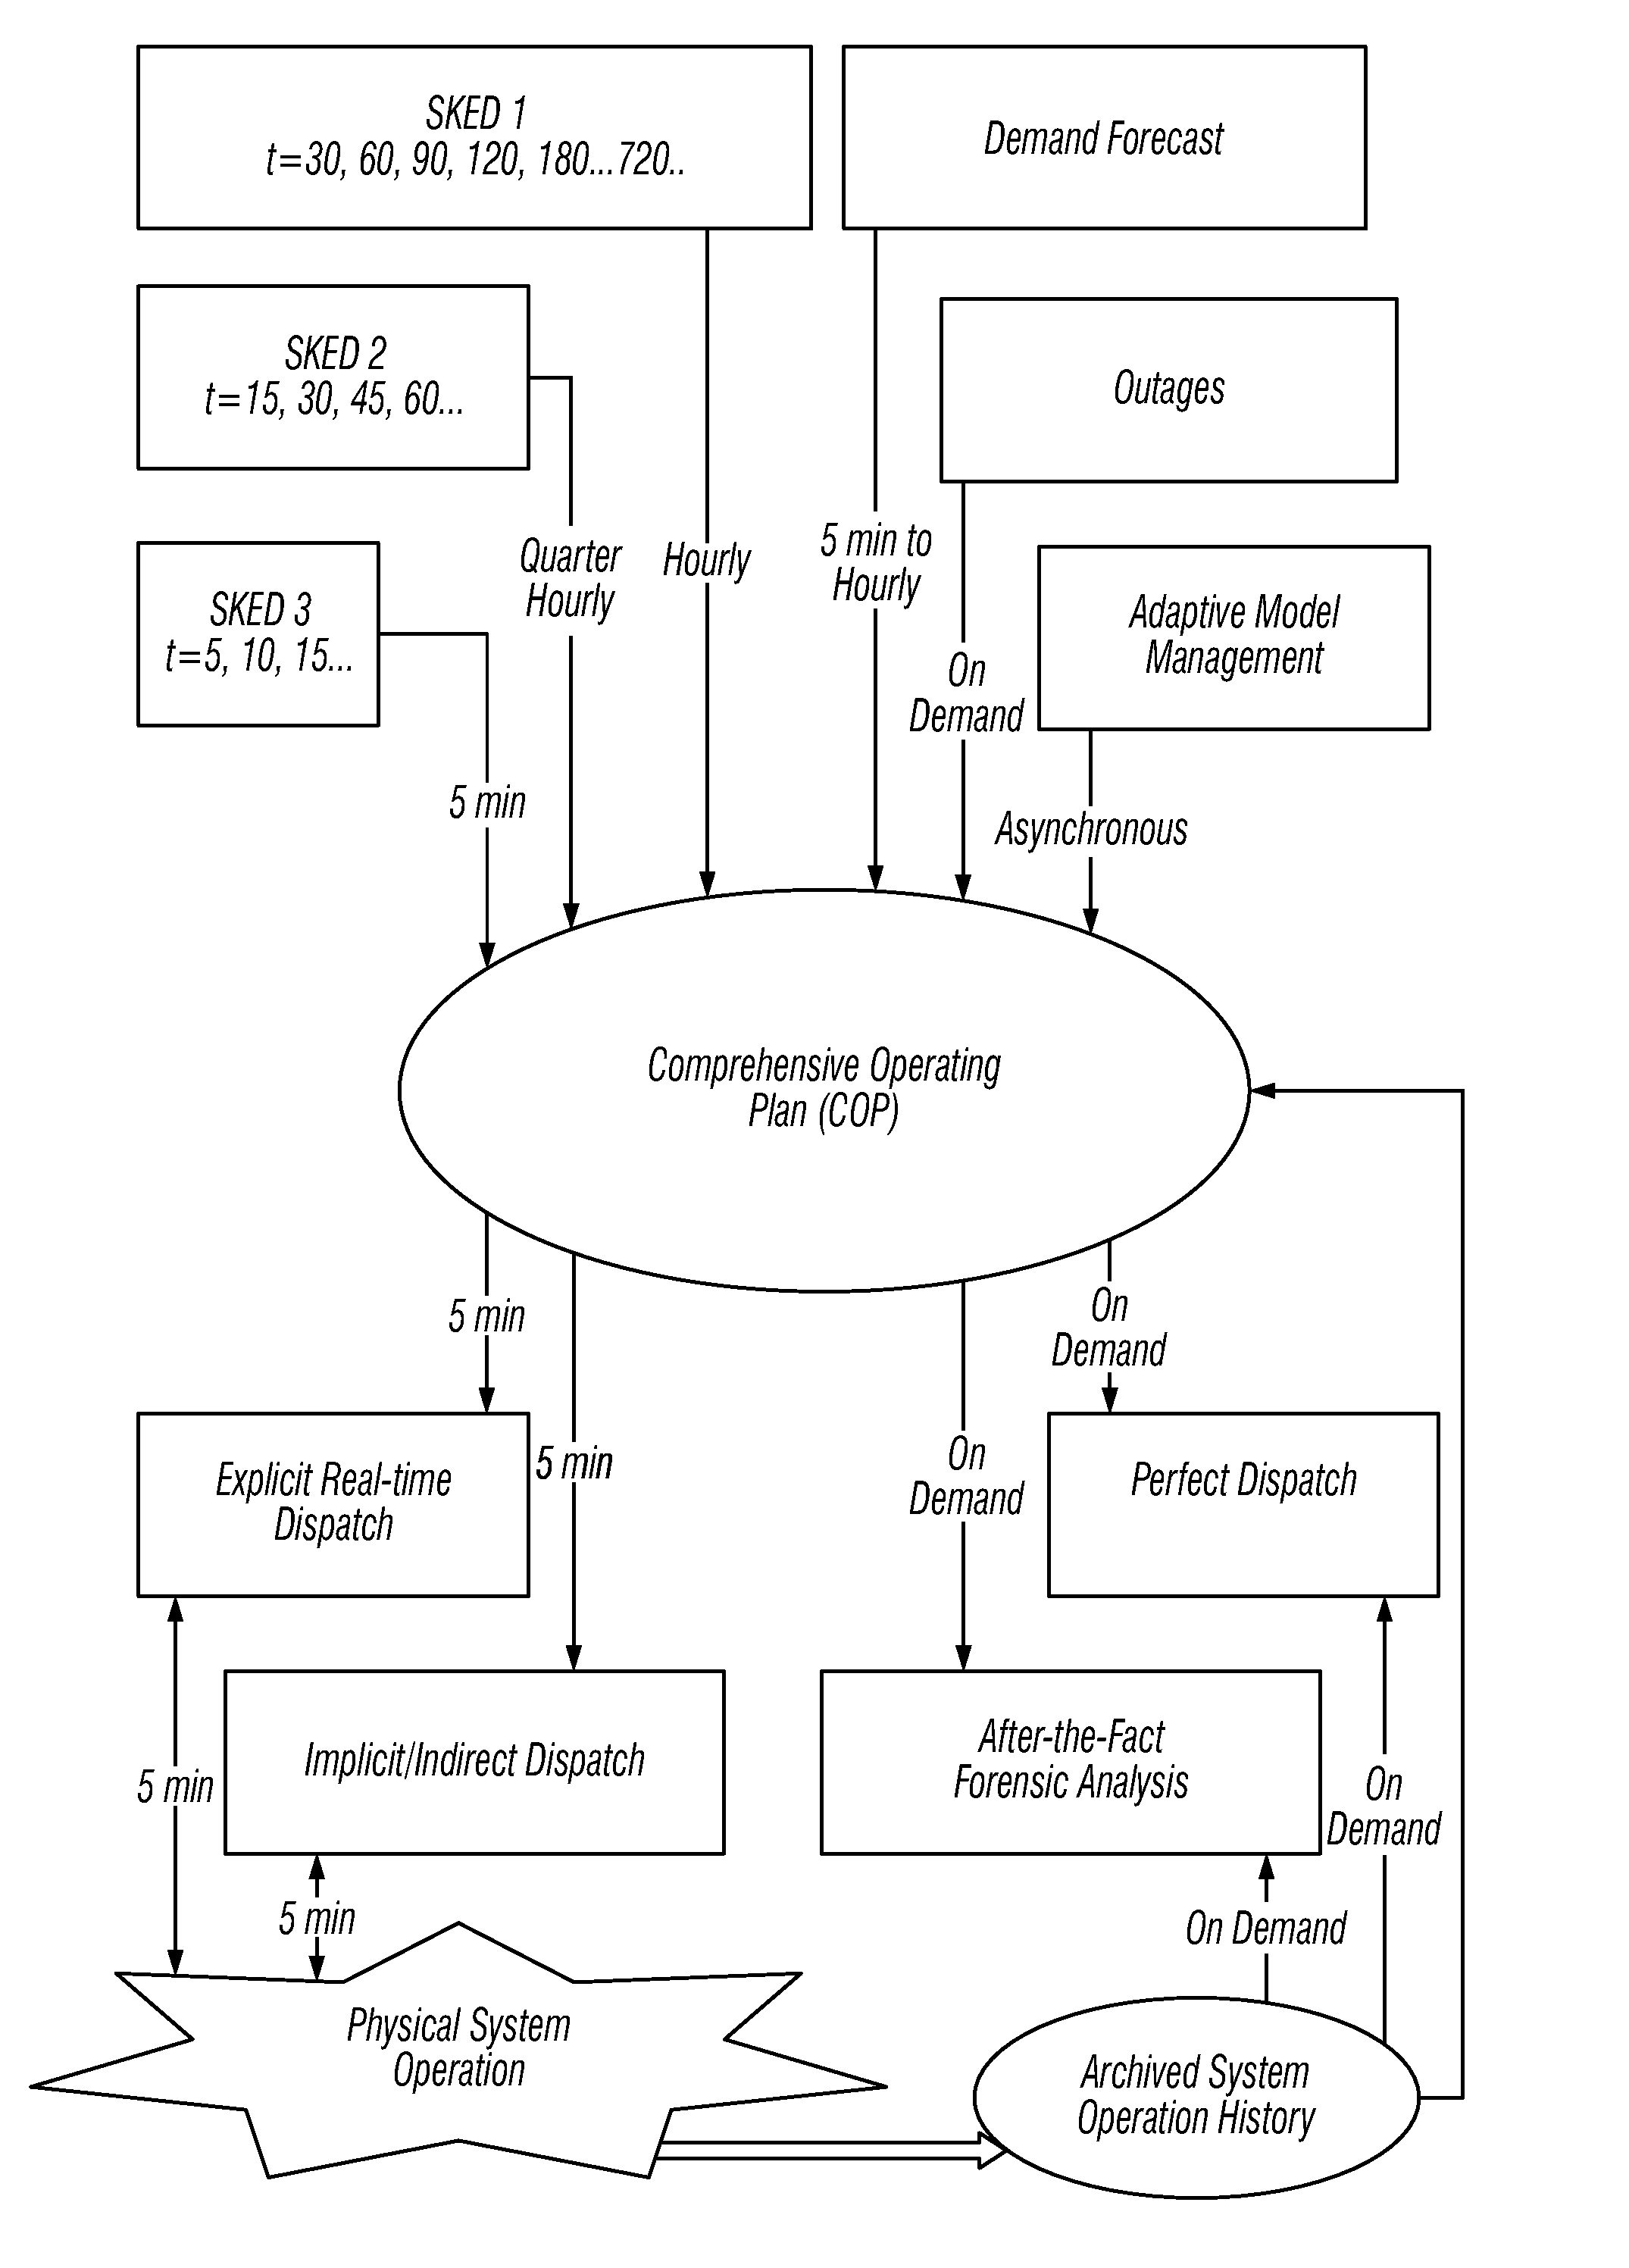
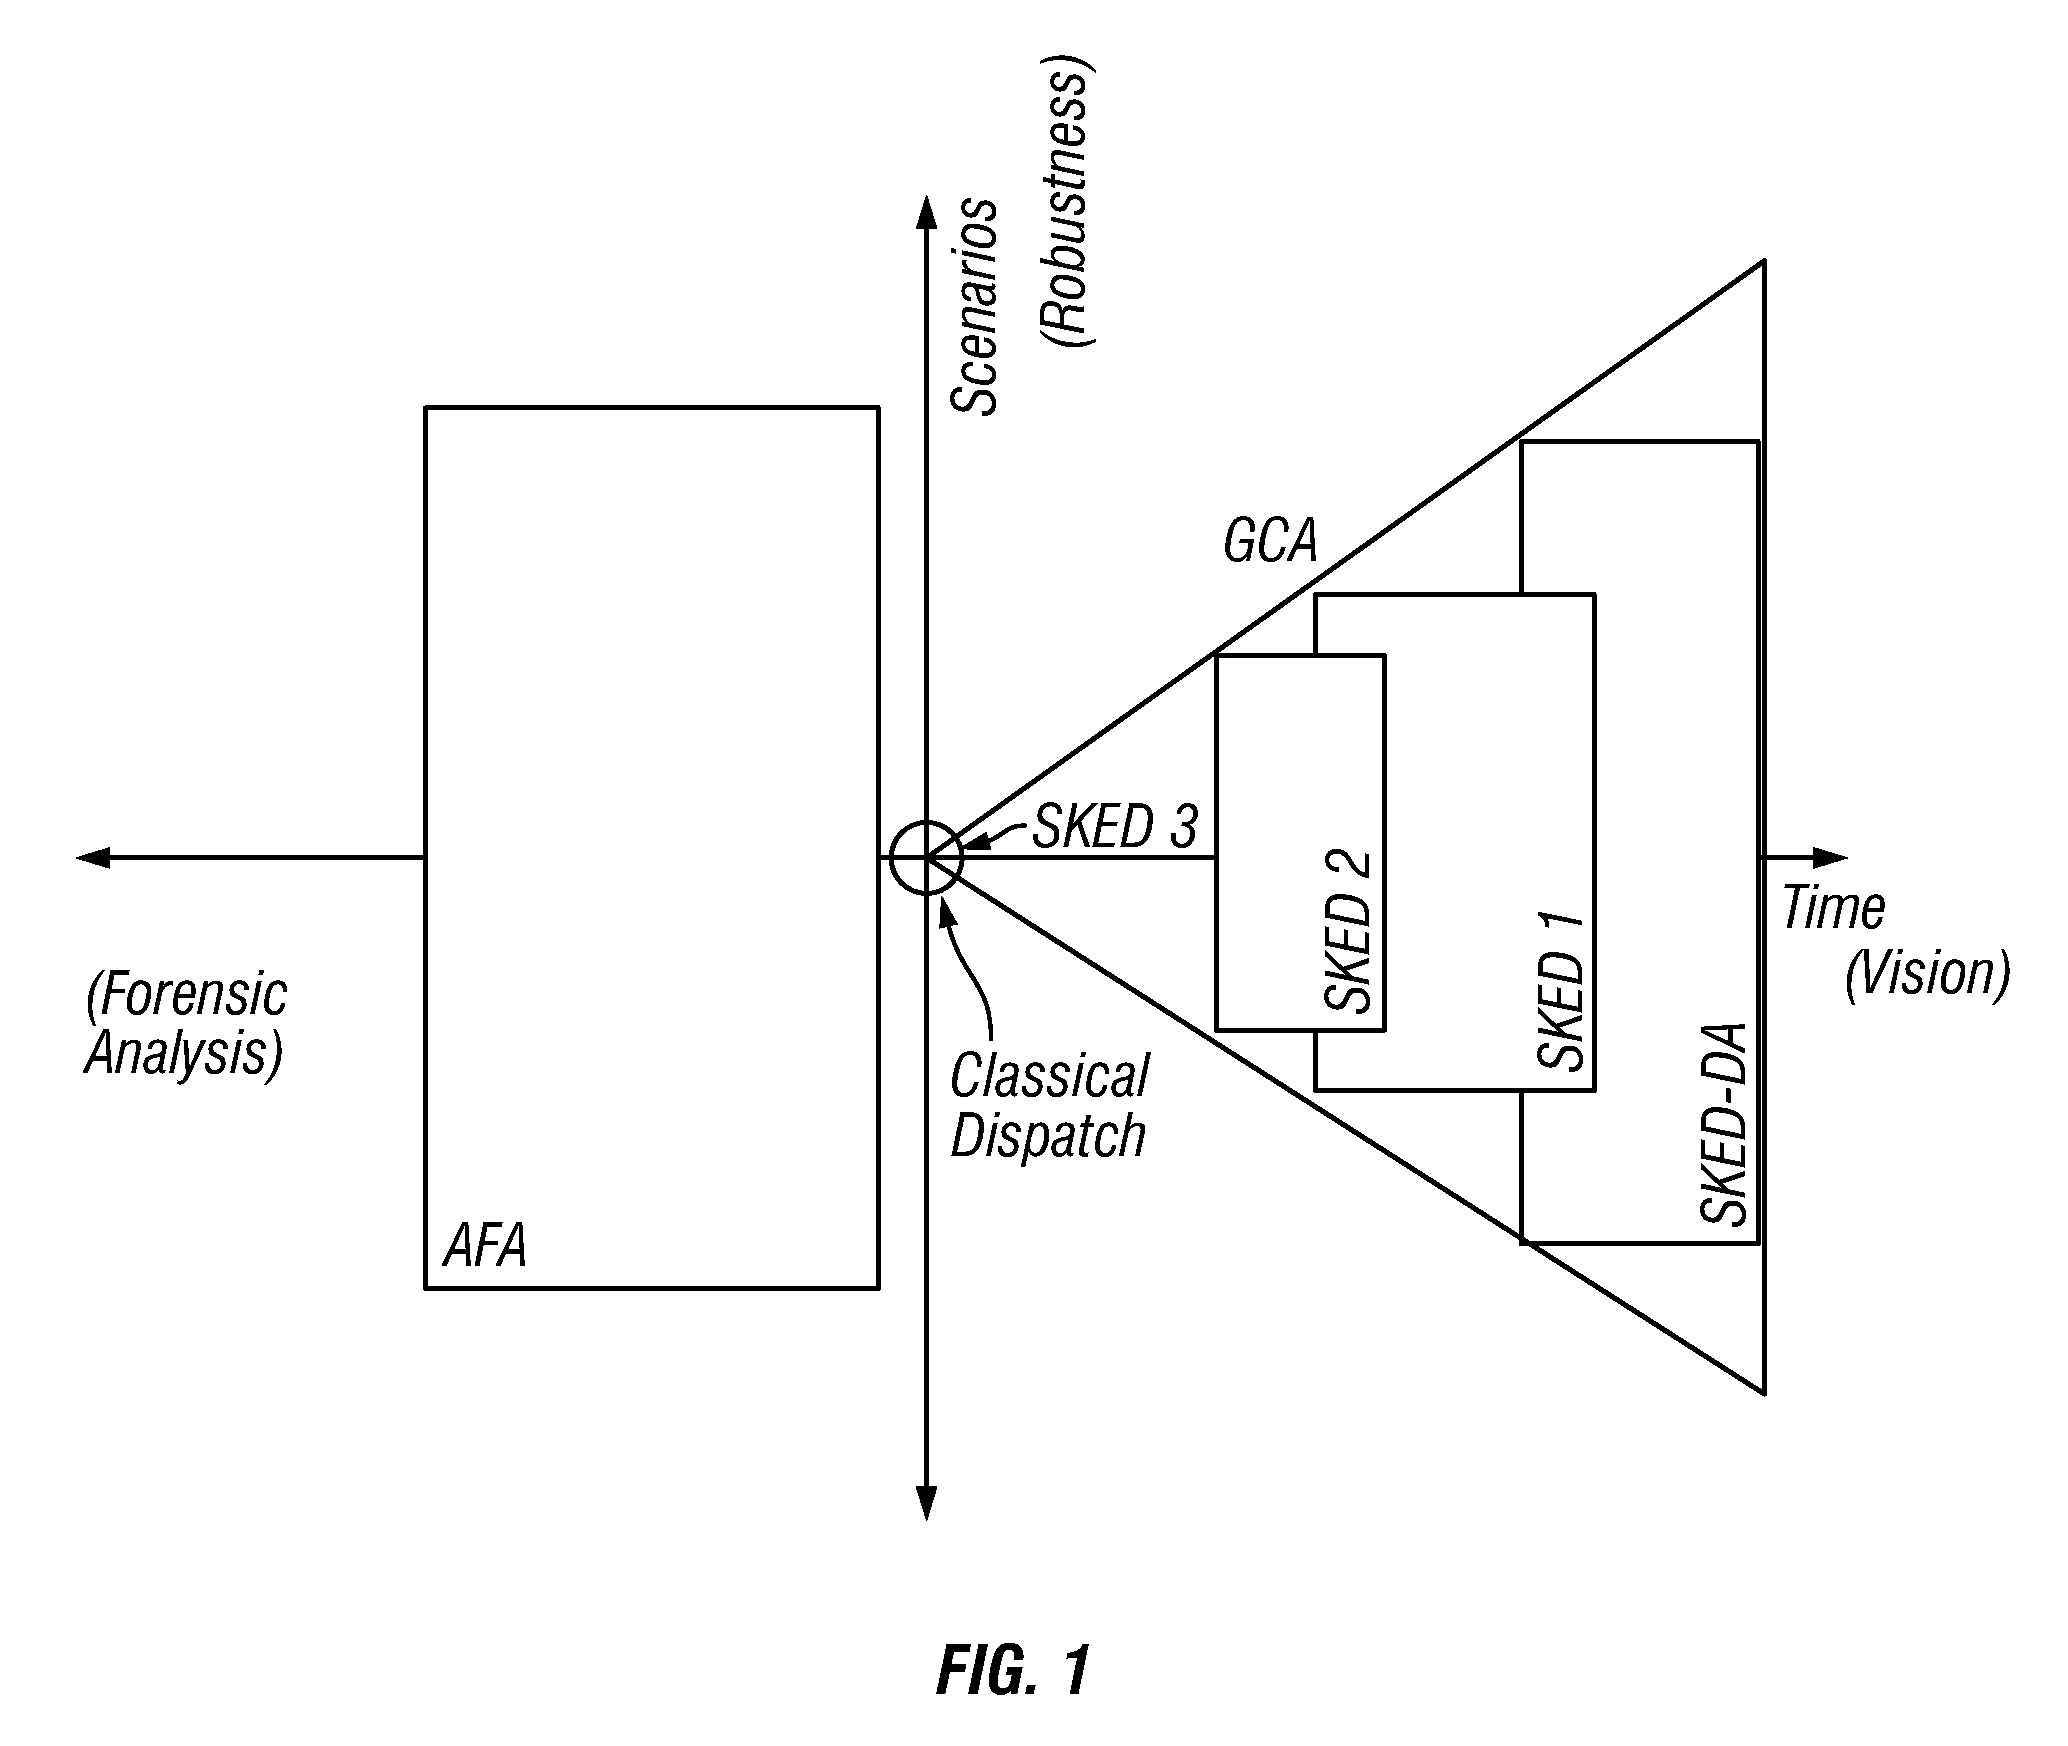
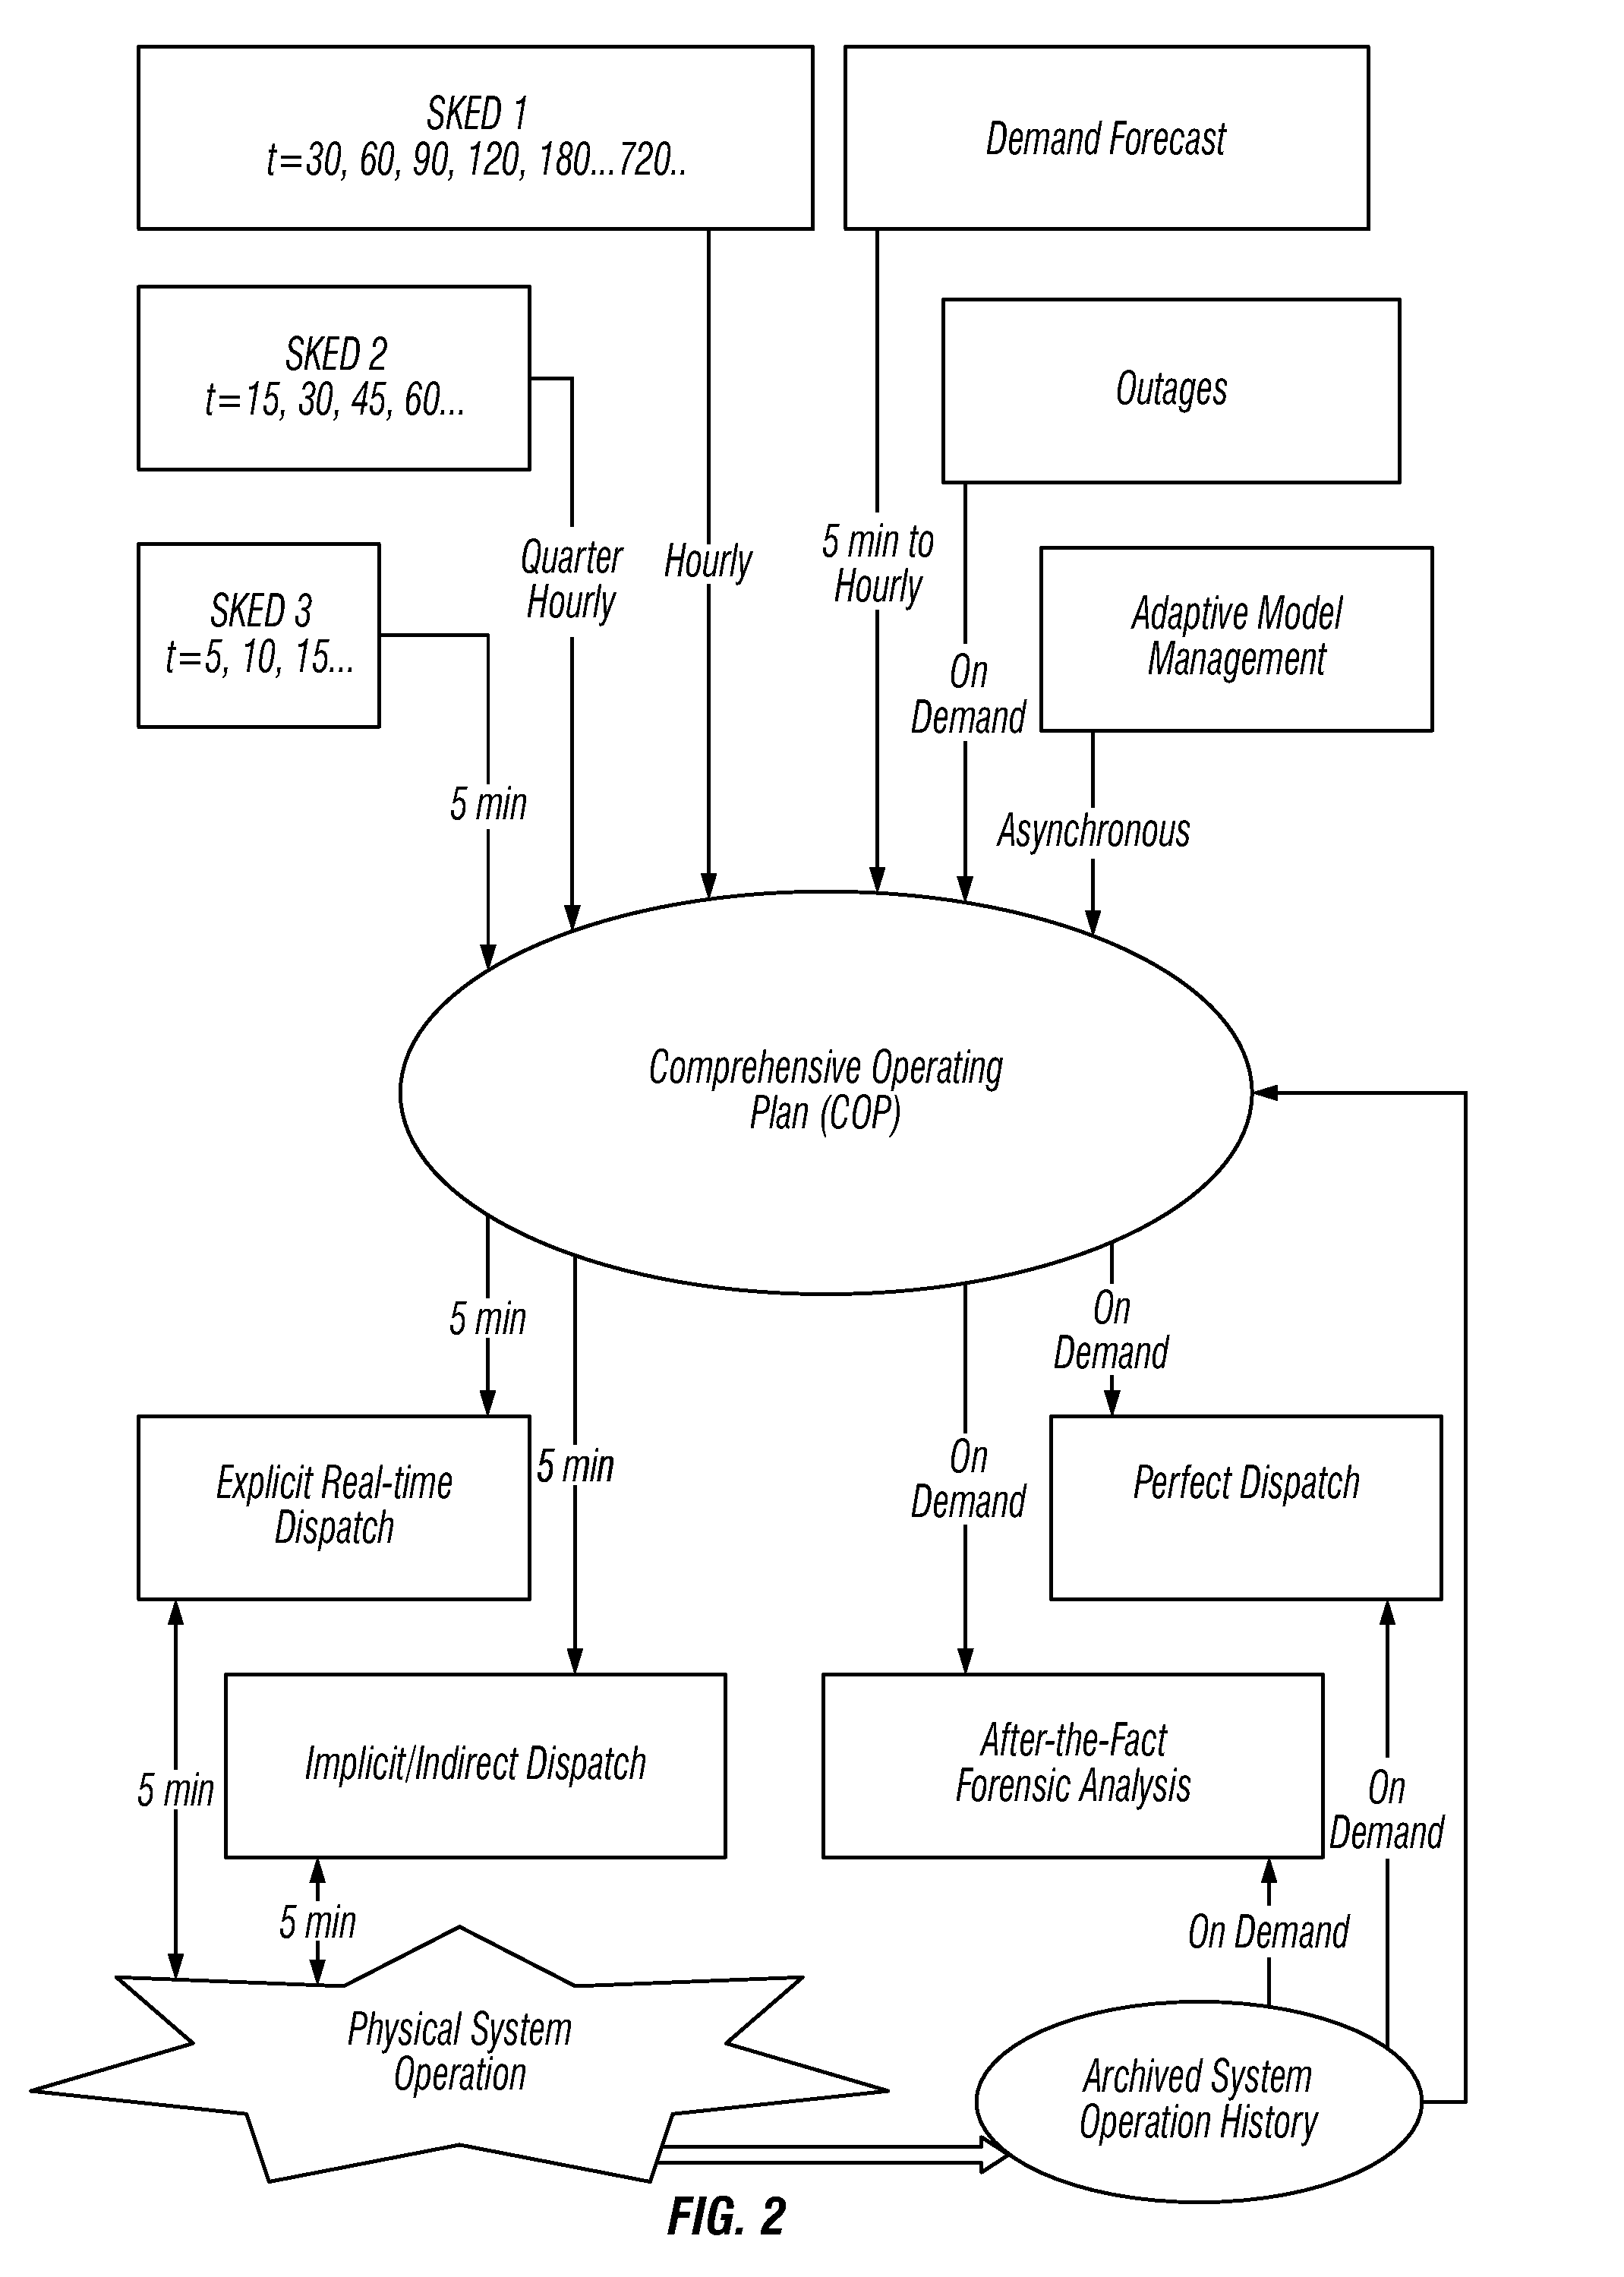
Classical dispatch of energy, (i) is cost based with centralized generation, (ii) is passive with static demand, (iii) has inaccurate parameters, (iv) has manual re-dispatch to relieve grid security violations, (v) uses ad-hoc forward scheduling that is disconnected from real time dispatch, (vi) designed only for rather normally inter-connected system operation and (vii) is limited in forensic analysis.
Outputs of many of the renewable resources do not follow traditional generation / load correlation but have strong dependencies on weather conditions, which from a system prospective are posing new challenges associated with the monitoring and controllability of the demand-supply balance.

Method used


Image

  • System tools for evaluating operational and financial performance from dispatchers using after the fact analysis
  • System tools for evaluating operational and financial performance from dispatchers using after the fact analysis
  • System tools for evaluating operational and financial performance from dispatchers using after the fact analysis

Examples


example 1

Use Case No 1

Submitting Load Forecast

[0171]This example illustrates adding new load forecast to one or more load forecast areas for the respective load forecast source. The trigger is load forecast engine 1 which submits a new load forecast. The demand forecast integrator validates the submitted information: valid load forecast source, valid leaf-level load forecast area, properly formed load forecast data points. demand forecast integrator overlays new load forecast on top of existing load forecast for load forecast engine 1. Assuming that the submitted load forecast's minimum and maximum time are Tmin and Tmax, all previous input from load forecast engine 1 within Tmin and Tmax inclusively can be deleted. Demand forecast integrator responds with a success message. As a post condition, load forecast from load forecast engine 1 is updated in demand forecast integrator. This example illustrates how new submittals contain better load forecast than the previous ones.

example 2

Use Case No 2

Submitting Load Forecast Overrides

[0172]This example illustrates adding load forecast override for one or more load forecast areas. In this example, the trigger occurs when an operator entered and saved load forecast override for a load forecast A. The market operator interface submits the overrides to the demand forecast integrator. demand forecast integrator validates the submitted information: valid load forecast source, valid leaf-level load forecast area, properly formed load forecast override data and the like. The demand forecast integrator adds the override values for the load forecast A. Assuming that the submitted override runs from T1 to T2, all previous override within T1 and T2 is removed. The submittal may include multiple set of overrides with non-adjacent time periods for the same load forecast A. Demand forecast integrator responds with a success message. The result is that demand forecast integrator contains additional overrides for the load forecast A...

example 3

Use Case No 3

Requesting Composite Load Forecast for the Market Operator Interface

[0173]This example illustrates obtaining a composite load forecast for the market operator interface. The trigger event is when the operator displays the composite load forecast for a specified time range. The market operator interface submits a request for the composite load forecast for the requested time range and load forecast A. The demand forecast integrator validates the submitted information which includes validating: (i) the load forecast source; (ii) the leaf-level load forecast area; (iv) from and to times; (v) time step, and the like. The demand forecast integrator constructs the composite load forecast or the demand forecast integrator retrieves the composite load forecast depending on the implementation. The demand forecast integrator responds with the composite load forecast, including overrides. The market operator interface displays the composite load forecast and overrides in a graphic...


PUM


Abstract

A decision-support tool is provided to evaluate operational and financial performance for dispatchers in power grid control centers associated with utility systems. A scheduler engine is coupled to a comprehensive operating plan that applies after the fact analysis for performance metrics, root-cause impacts and process re-engineering. A relational database is coupled to a data archiver that captures actual system and resource conditions and then supplies the system and resource conditions to the relational database. The scheduler engine receives the actual system and resource conditions from the relational database and processes it to calculate system performance. A user interface is configured to display at least one of, transmission evaluation application displays, reference and scenario cases and associations between them, results presented with a graphical or tabular displays, comparison results between scenario cases and a reference case, a family of curves where each curve is a performance metric, comparison of scenario input data, study results and statistical analysis and historical data.

Description

BACKGROUND[0001]Field of the Invention[0002]The present invention relates generally to system tools for evaluating operational and financial performance for dispatchers in power grid control centers associated with utility systems, and more particularly to system tools that use after the fact analysis.[0003]Description of the Related Art[0004]With respect to the electric power grid, expensive peak power—electric power delivered during periods of peak demand—can cost substantially more than off-peak power. The electric power grid itself has become increasingly unreliable and antiquated, as evidenced by frequent large-scale power outages. Grid instability wastes energy, both directly and indirectly, for example, by encouraging power consumers to install inefficient forms of backup generation.[0005]Clean forms of energy generation, such as wind and solar, suffer from intermittency. Hence, grid operators are reluctant to rely heavily on these sources, making it difficult to move away fr...

Claims


Application Information

Patent Timeline
Patent Type & Authority Patents(United States)
IPC IPC(8): G06Q10/06G06F17/30G06Q10/04
CPCG06Q10/06G06F17/30557G06Q10/04Y04S10/54Y04S10/60G06F16/25Y04S10/50
Inventor SUN, DAVIDCHEUNG, KWOKCHIU, BUT-CHUNGWANG, XINGXIAO, YINGMOK, KEEYAO, MIKE
Owner ALSTOM TECH LTD
Why Eureka
Try Eureka