
Method and system to characterize transcriptionally active regions and quantify sequence abundance for large scale sequencing data

a technology of large-scale sequencing and sequence abundance, applied in the field of sequence data analysis system, can solve the problems of high-throughput sequencing for rna expression profiling and genome-wide biomarker discovery, the genomic transcribed regions of the genomic transcribed regions are often not well defined, and the cost of dna sequencing technology has been trending down quickly

Active Publication Date: 2013-10-22
GENOMIC HEALTH INC
View PDF4 Cites 6 Cited by
  • Summary
  • Abstract
  • Description
  • Claims
  • Application Information

AI Technical Summary

Problems solved by technology

The cost of DNA sequencing technology has been trending down quickly and the trend will continue for decades to come.
However, application of high throughput sequencing for RNA expression profiling and genome scale biomarker discovery may encounter issues in the following areas:
However, for the less known non-coding RNAs including microRNA and many other small RNAs, their genomic transcribed regions are often not well defined.
The sequencing output sequences for these non-coding regions are often not well-aligned due to either biological or technical reasons.
This inexact mapping makes it very difficult to derive the transcriptionally active regions for expression profiling analysis.
In high throughput setting, quantifying the number of nucleotide sequences is a challenge because the output sequences usually do not align exactly to the reference sequences even though they are derived from the same gene.
Additionally, the reverse transcription to convert RNAs into complementary DNAs (cDNAs) for sequencing is often partial or incomplete.
This inexact mapping of sequencing output sequences makes the quantification of the RNA levels for the genes or transcriptionally active regions difficult and not straightforward.
The computing intensity and cost is high due to the complexity of sequence alignment algorithms such as Needleman-Wunsch algorithm (Needleman and Wunsch 1970), Smith-Waterman algorithm (Smith and Waterman 1981), or other similar algorithms.

Method used


Image

  • Method and system to characterize transcriptionally active regions and quantify sequence abundance for large scale sequencing data
  • Method and system to characterize transcriptionally active regions and quantify sequence abundance for large scale sequencing data
  • Method and system to characterize transcriptionally active regions and quantify sequence abundance for large scale sequencing data

Examples


example 1

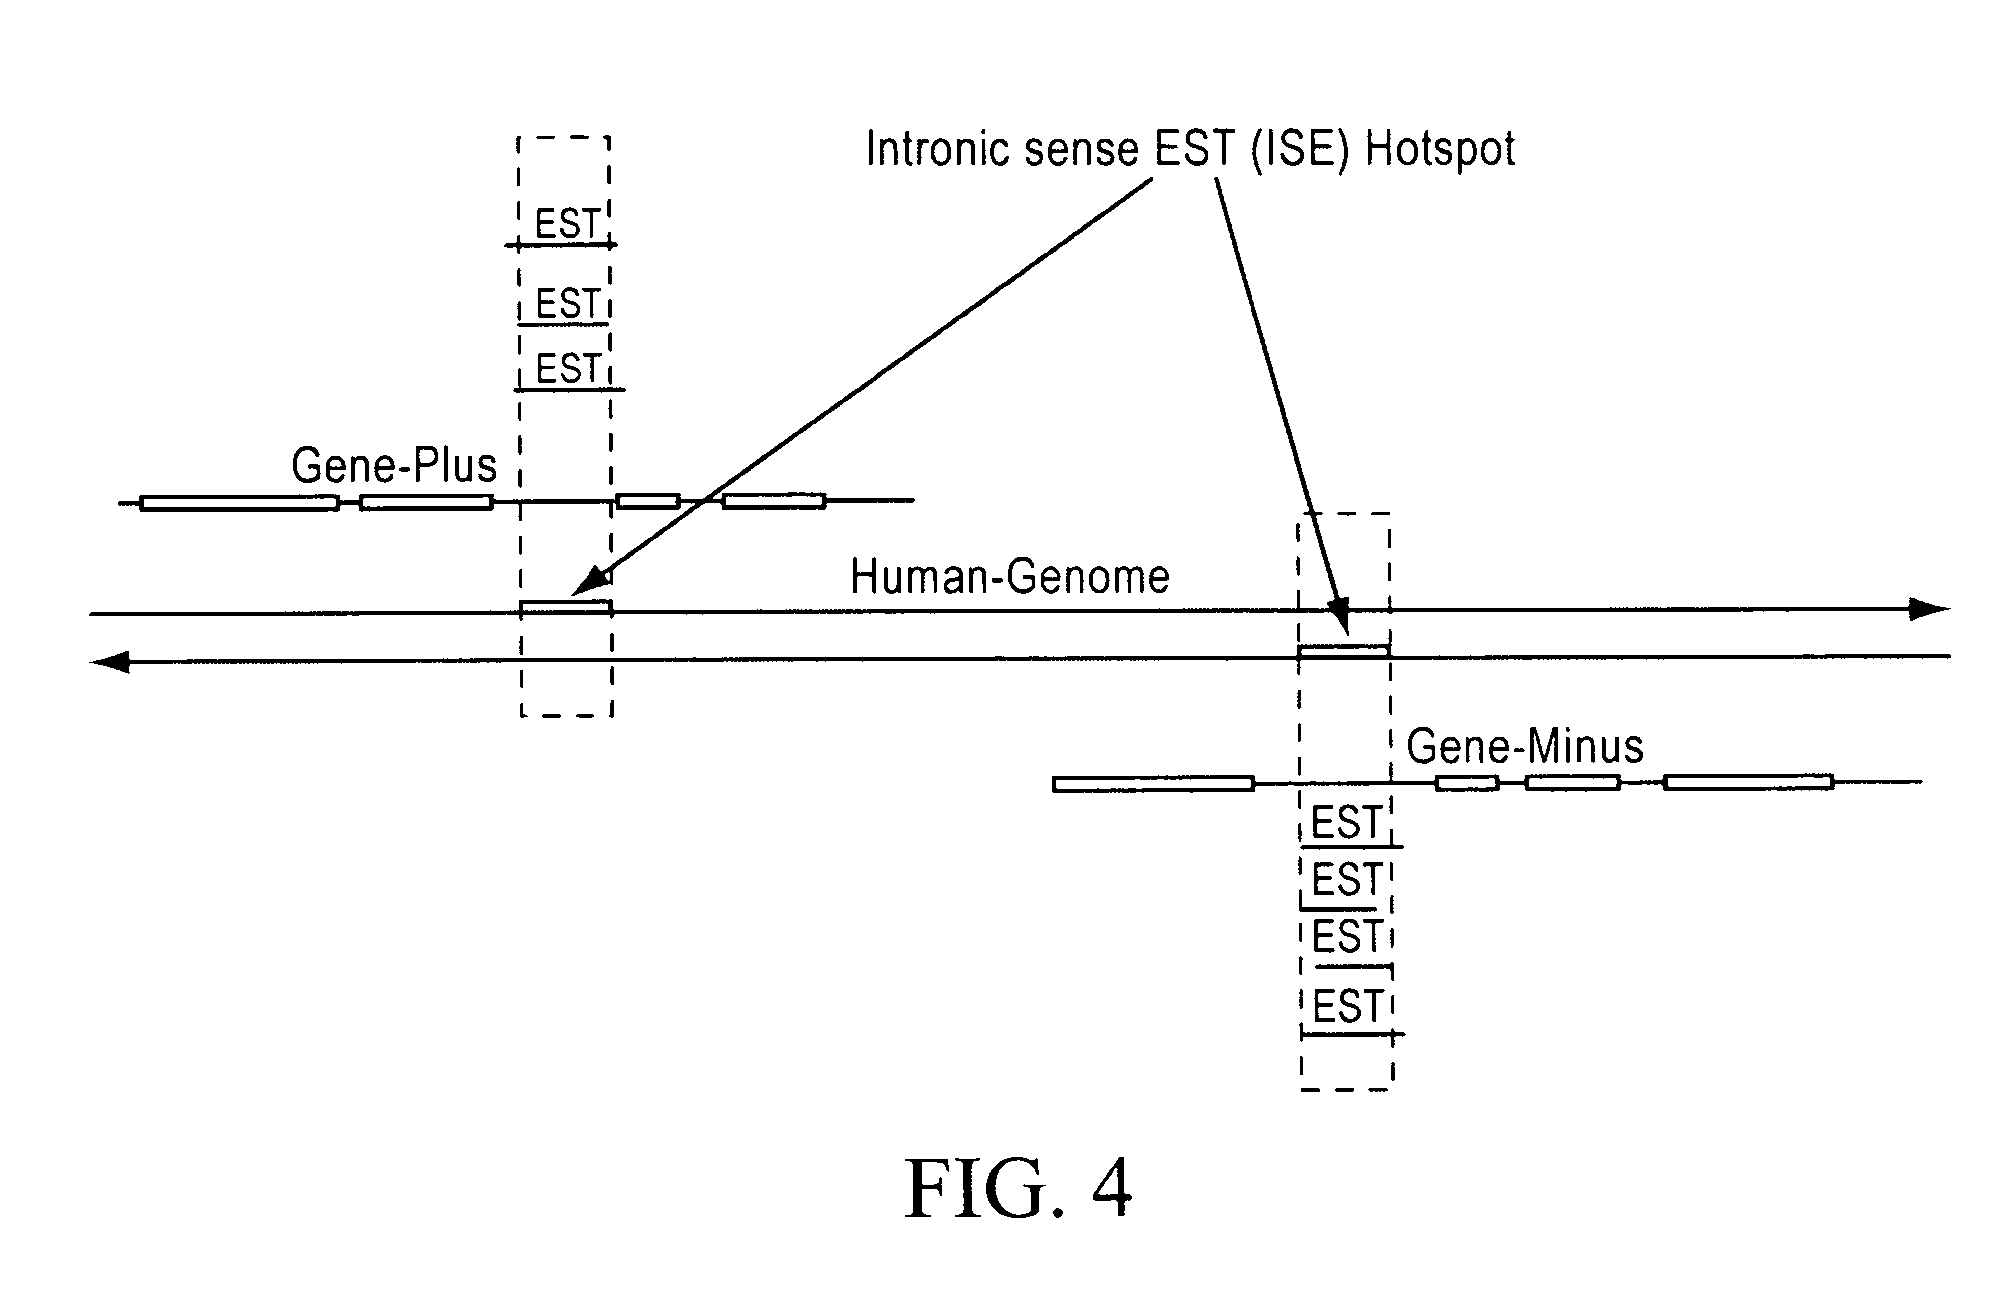
Computational Identification of Human Intronic Sense EST (ISE) Hotspots Reveals Potential Functional RNA Elements

[0077]Recent evidence suggests that a large portion of the mammalian genome is transcribed. Expressed sequence tags (ESTs) identified through large sequencing projects mark the transcribed regions of the genome. EST hotspots, genomic regions where many ESTs are mapped, may have significant biological functions and biomarker potential although many of them map to the non-coding portions of genes. The instantly claimed method applies a transcriptionally active region discovery algorithm to identify EST hotspots in the genome and to quantify their “hotness” by calculating an abundance score. Using the public dbEST data, the instant method was able to identify a set of human intronic sense EST (ISE) transcriptionally active regions, or “hotspots”. The results show that the ISE transcriptionally active regions likely represent both coding and non-coding functional RNA elements...

example 2

[0087]In another example, an expression profile dataset for human tissues was generated from a proprietary sequencing dataset of approximately thirteen million ESTs. Recent evidence indicates that approximately 60% of the mammalian genome is transcribed. The transcribed RNA sequences can be effectively detected through large scale sequencing projects and outputted as expressed sequence tags (ESTs). ESTs mark the transcribed sequences in the genome, frequently map to noncoding regions, i.e., intronic or intergenic gene sequences. These non-coding ESTs may identify functional RNA elements that have significant biological function and biomarker potential. Thus there is a need for an efficient method to identify functional RNA elements through EST sequencing and data analysis.

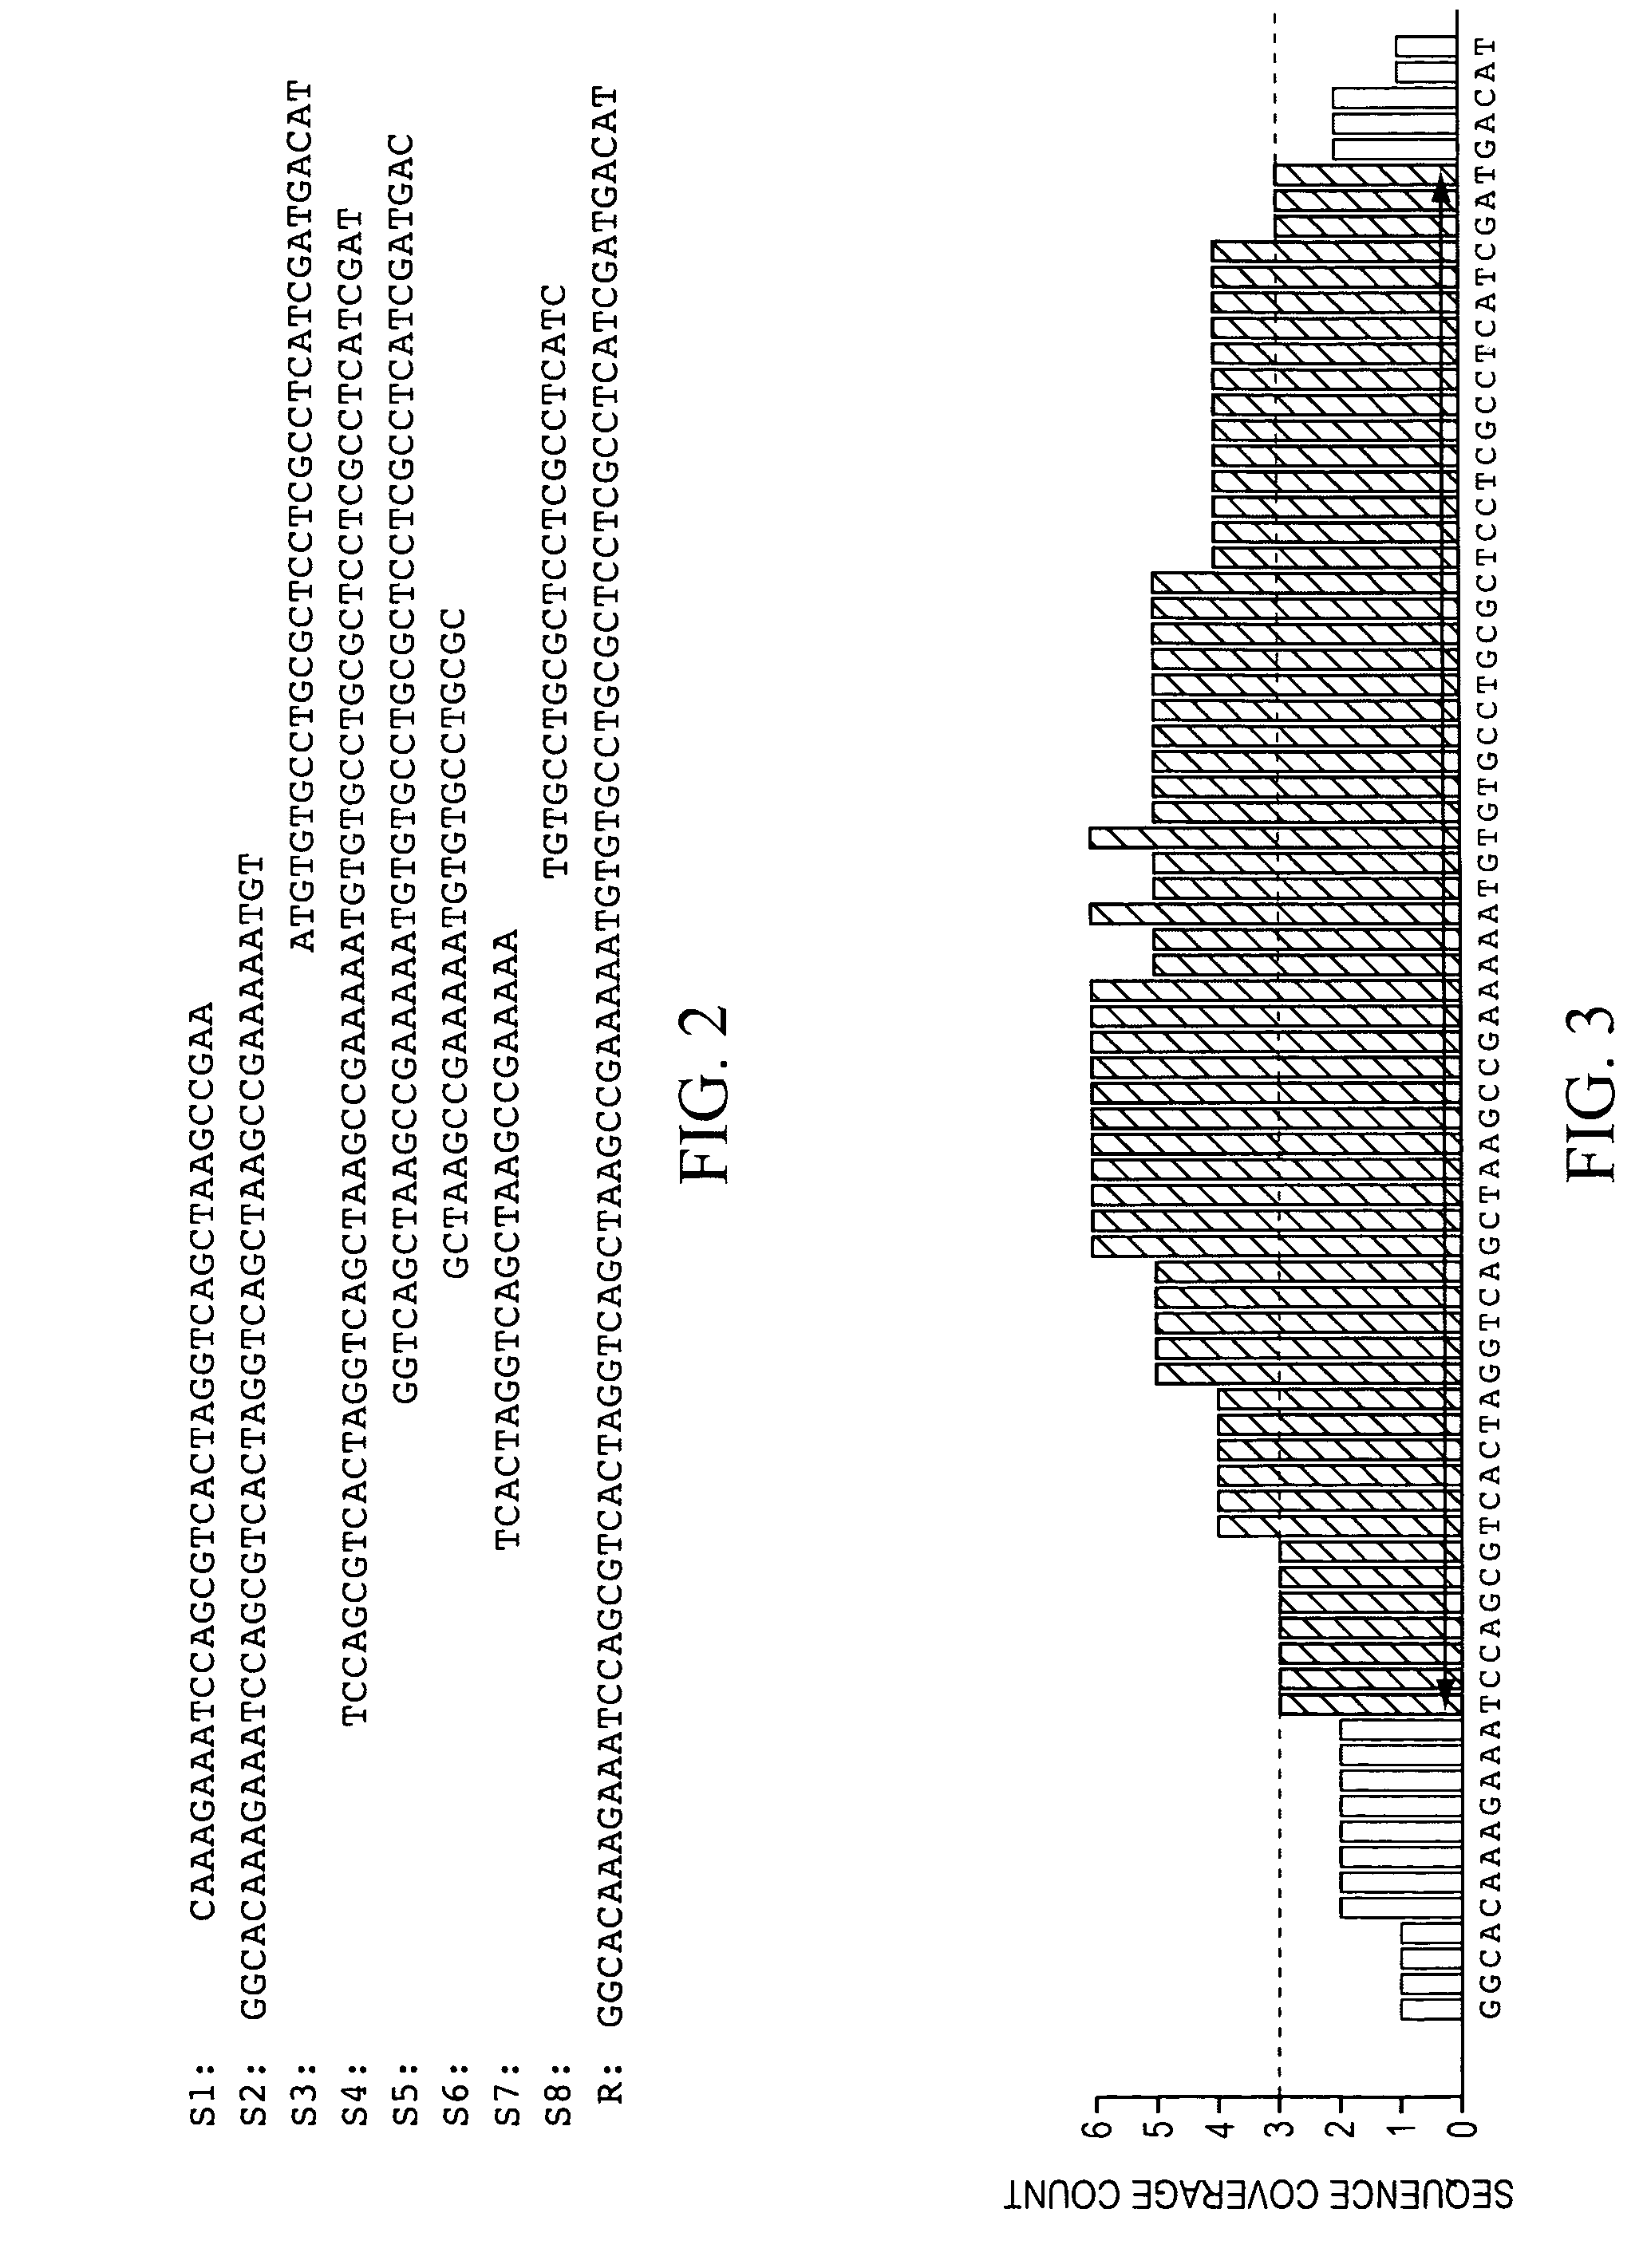
[0088]In this example, an SQL database management system was utilized to create and implement an efficient algorithm that identifies transcriptionally active regions (TARs) in the genome and quantifies their abunda...


PUM

PropertyMeasurementUnit
thresholdaaaaaaaaaa
lengthaaaaaaaaaa
overlap lengthaaaaaaaaaa

Abstract

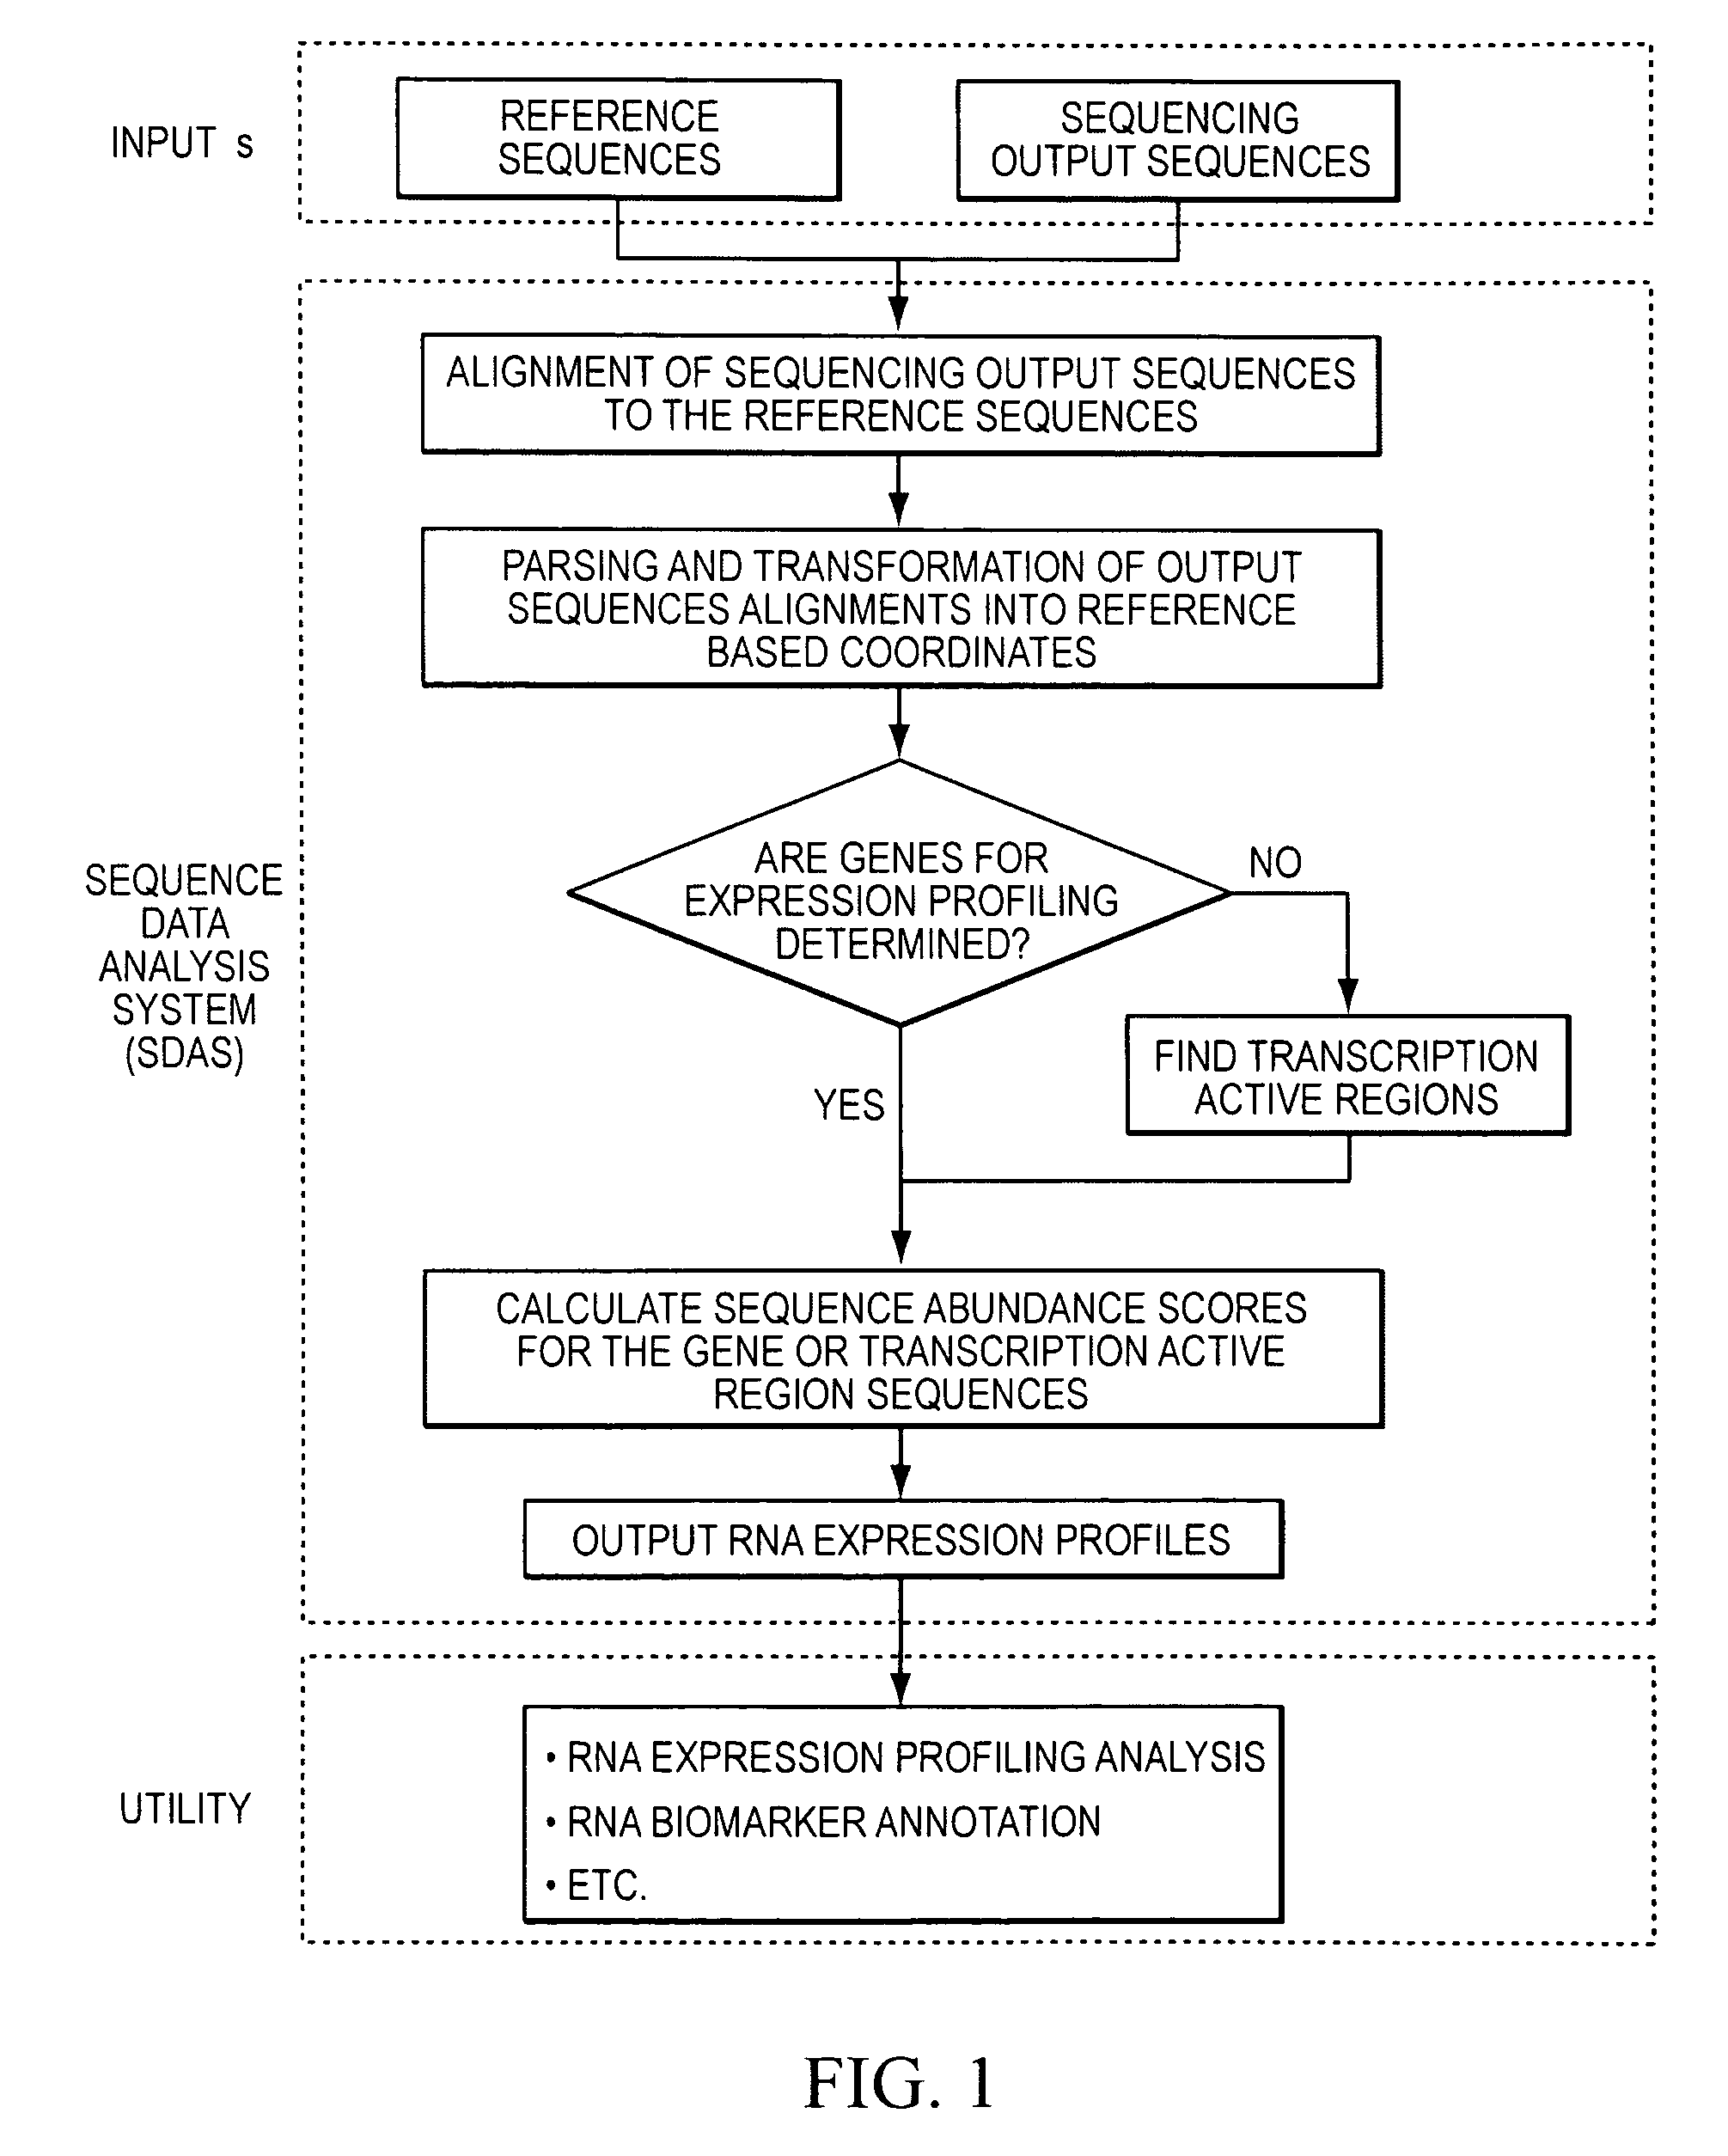
This invention provides a quantitative method to determine transcriptionally active regions and quantify sequence abundance from large scale sequencing data. The invention also provides a system based on reference sequences to design and implement the method. The system processes large scale sequence data from high throughput sequencing, generates transcriptionally active region sequences as necessary, and quantifies the sequence abundance of the gene or transcriptionally active region. The method and system are useful for many analyses based on RNA expression profiling.

Description

FIELD OF THE INVENTION[0001]This invention relates generally to a sequence data analysis system using methods for processing nucleic acid sequencing output-with a reference sequence based design to identify transcriptionally active regions and quantify the sequence abundance which can be used for expression profiling analysis.DESCRIPTION OF THE RELATED ART[0002]DNA sequencing technology has played a key role in the advancement of genomic study and research for health sciences for more than 10 years. At the same time, the completion of the human genome sequencing project has been recognized as one of the most significant milestones for research and drug development. Recently several next generation sequencing technologies have made it possible to read billions of nucleotides in a single experiment. The availability of billion nucleotide scale sequencing and its expected cost reduction has expanded the potential applications of sequencing to area such as RNA expression profiling and g...

Claims


Application Information

Patent Timeline
Patent Type & Authority Patents(United States)
IPC IPC(8): G01N33/48G06F19/00G16B30/10G16B25/10
CPCG06F19/22G06F19/20G16B25/00G16B30/00G16B30/10G16B25/10
Inventor LI, XITONGSTINEMAN, KENNETH
Owner GENOMIC HEALTH INC
Learn More