Compact batch viewing techniques for use in batch processes

a batch processing and batch technology, applied in the field of process control networks, can solve the problems of cumbersome user interface, many presently available tools, and inability to integrate with other tools, and achieve the effect of quick and easy examination, easy viewing or understanding

Active Publication Date: 2010-09-07
FISHER-ROSEMOUNT SYST INC
View PDF46 Cites 24 Cited by
  • Summary
  • Abstract
  • Description
  • Claims
  • Application Information

AI Technical Summary

Benefits of technology

[0019]A data collection and viewing application within a process control system for a process plant provides a user interface that allows a user to quickly and easily examine a particular batch process or a batch run, compare separate batch runs and / or determine whether the particular batch run deviates from a norm, without having to perform a lot of manual data manipulation. In particular, the user interface provides or creates a compact graphical representation of a batch, illustrating a number of different types of batch-related data in relation to one another in a manner that enables a user to easily view or understand the operation of the batch run, either alone or as compared with one or more other batch runs.

Problems solved by technology

However, many presently available tools for reporting on batch process quality and progress fall far short of such integration.
Further, to the limited extent present solutions provide such integration, a user is required to provide significant, detailed configuration information to permit the reporting programs to correlate the various types and sources of event information and continuous data.
For example, many present tools used in batch processing gather continuous data from the batch process while other tools provide the user with a cumbersome interface to locate particular sections of interesting data.
In some instances, the definition may be more complex, requiring the user to identify other parameters that identify data corresponding to a particular procedural element.
The access of and configuration of this information often entails a complex task for the user, requiring significant user knowledge of the events of interest and the likely characteristics of data relevant to those events of interest.
Furthermore, regardless of the complexity of defining the filter for associating data with a procedural event, the process of defining such filters to associate data with batch events is a largely manual process.
Such manual processes are prone to error such that the relationships between event information and related continuous data may be incorrectly established.
Though the query capabilities of the existing techniques may be significant, these techniques generally provide little more than a relational database “front-end” for accessing data.
Another problem with many present batch processing tools arises in the presentation of process and batch event information to a user.
Present batch historian features of batch processing systems therefore provide limited flexibility in presentation of data to a user.
For example, the relationships among batch events or process events and continuous data is difficult to discern from the tabular, textual presentations of present historian programs.
However, even in this case, the view of the batch is presented in a Gantt chart, which can make it hard to understand or view an entire batch process in a manner this is useful or meaningful to a user.
Thus, as will be understood, to view the ongoing operation of a batch, it is not possible to take a simple snapshot of the batch process at any particular time and display that data to a user, as the batch process has various different procedural elements, which may be run on different equipment within the plant at different times, using different setpoints, settings, etc.
This fact makes it difficult for the operator to have a comprehensive view of any particular batch process.

Method used


Image

  • Compact batch viewing techniques for use in batch processes
  • Compact batch viewing techniques for use in batch processes
  • Compact batch viewing techniques for use in batch processes

Examples


Embodiment Construction

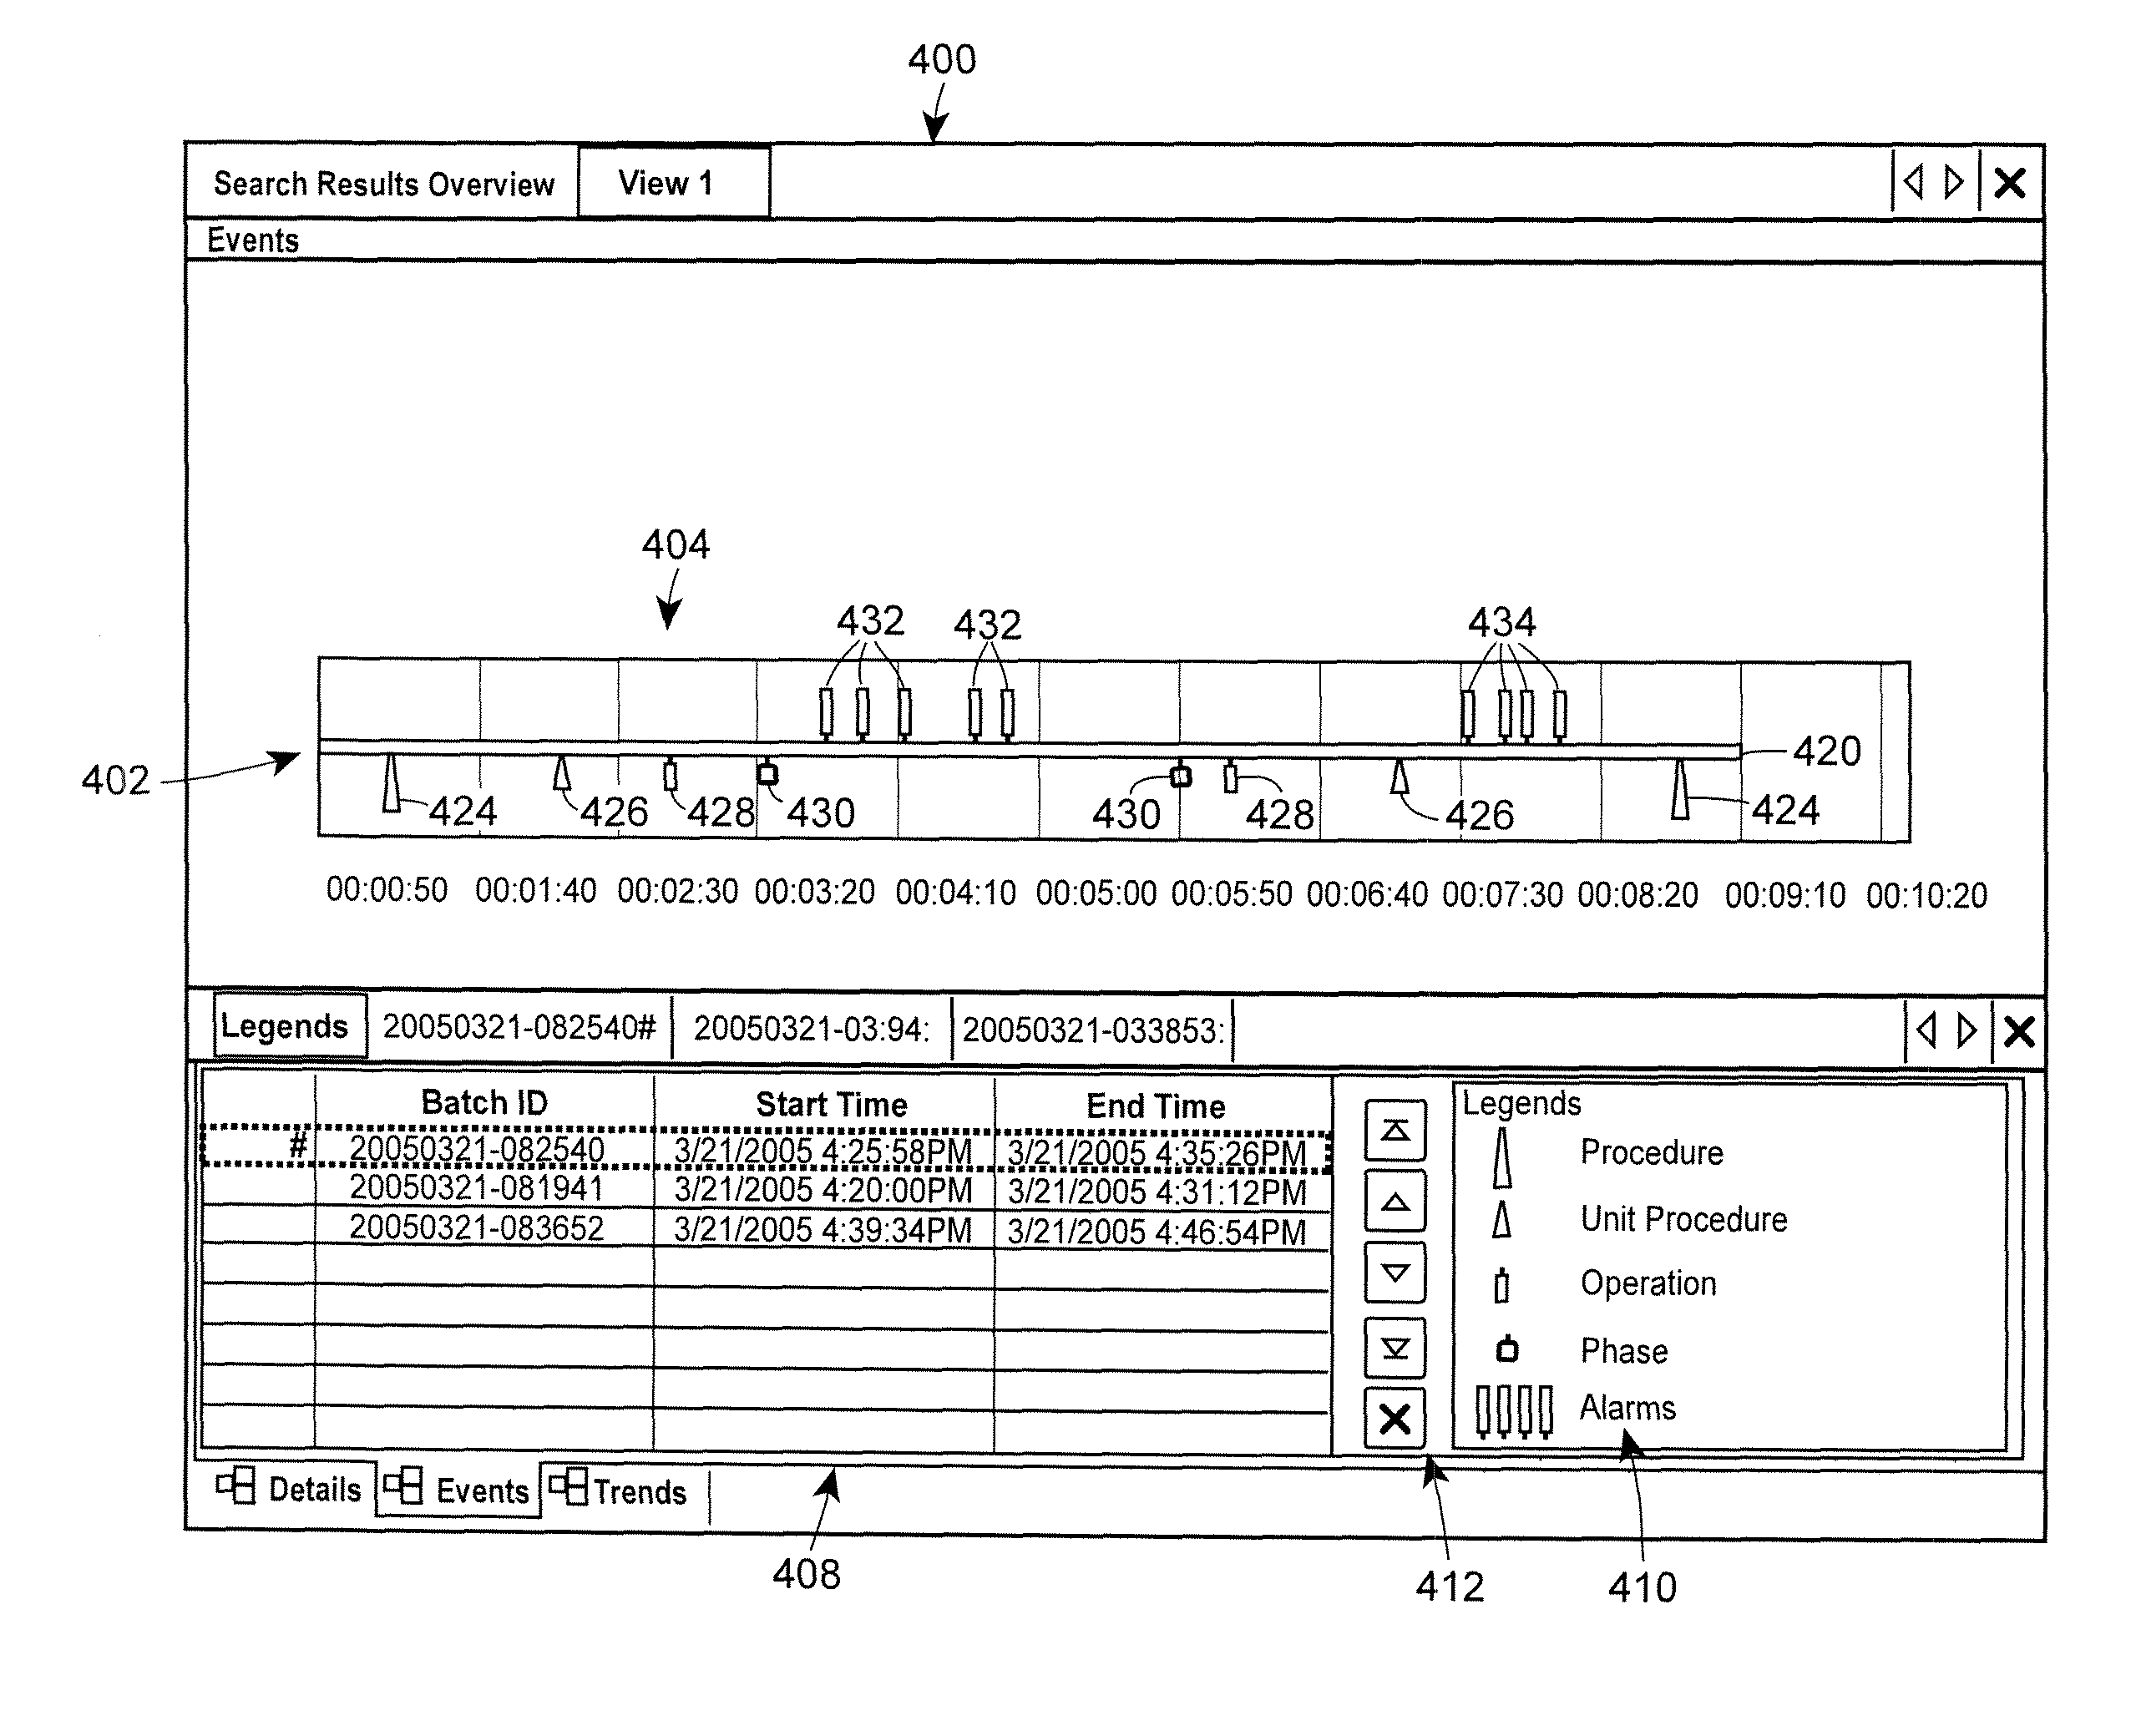
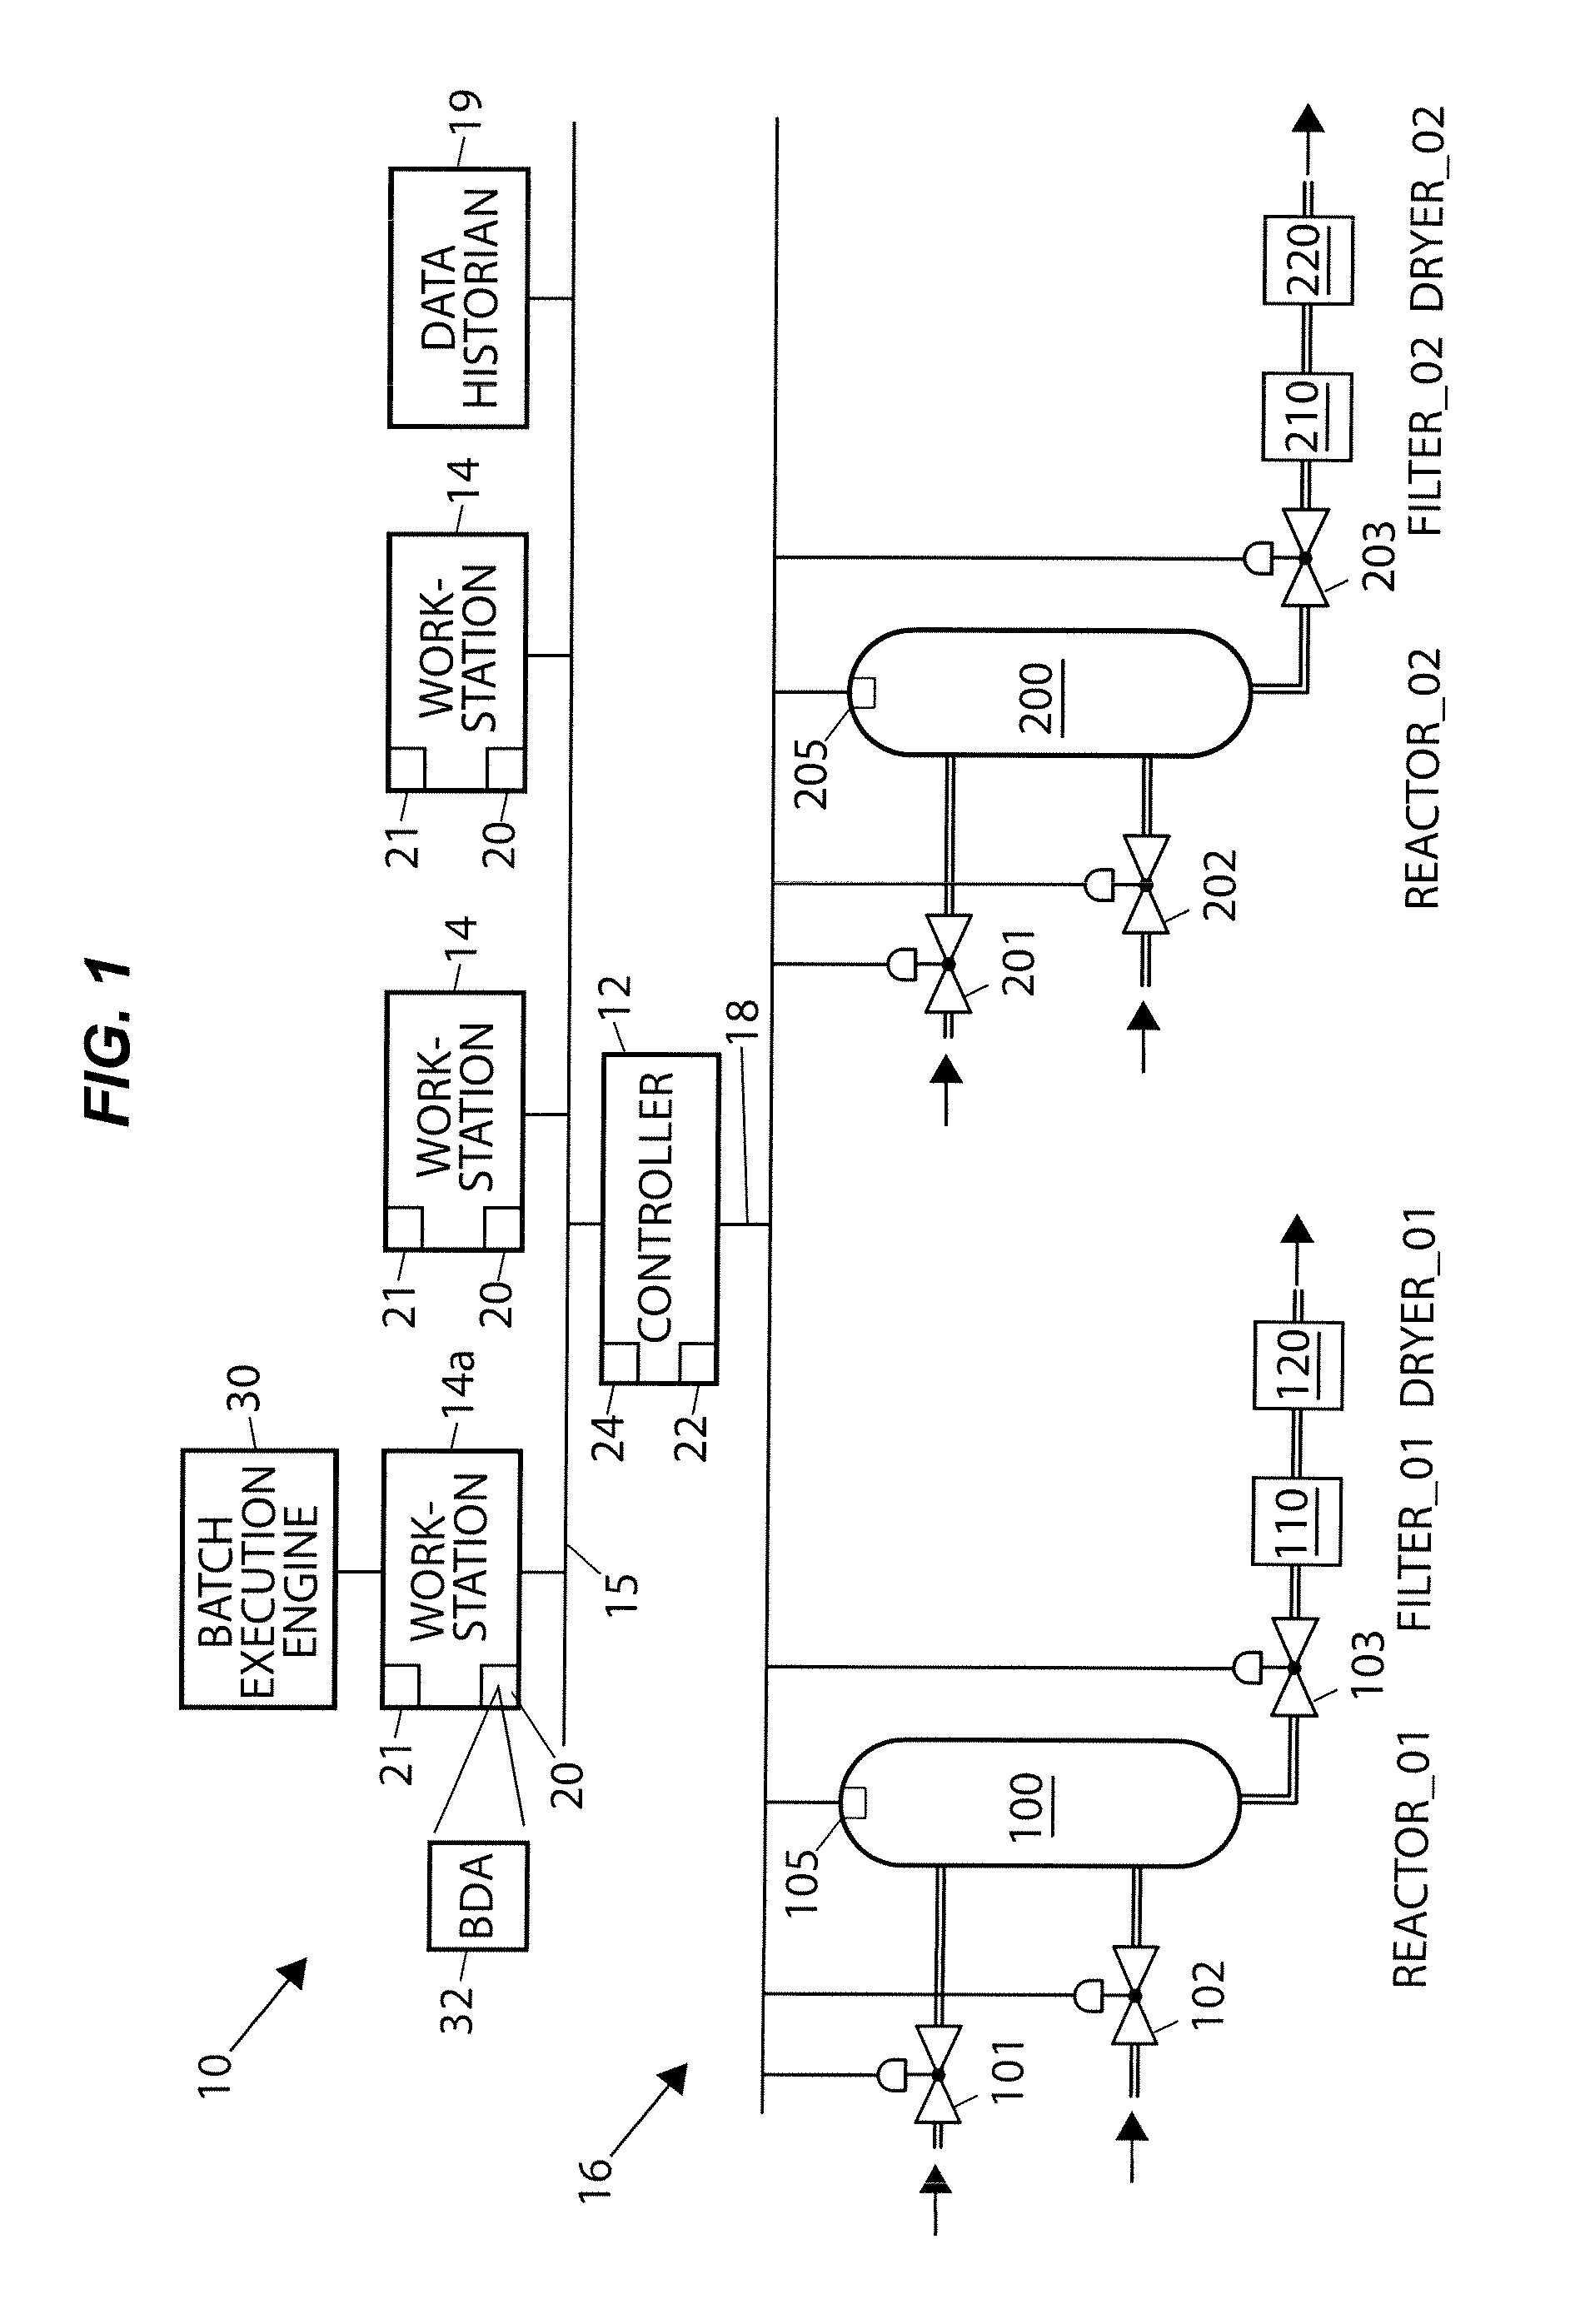
[0029]Referring now to FIG. 1, a process plant control network 10 includes a process controller 12 coupled to numerous workstations 14 via, for example, a local area network (LAN) 15, which may in one example be an Ethernet communications connection. The controller 12 is also coupled to devices or equipment within a process plant (generally designated by the reference numeral 16) via one or more input / output (I / O) devices (not shown) and a set of communication lines and / or a bus 18. The controller 12, which may be by way of example only, the DeltaV™ Batch controller sold by Emerson Process Management, is capable of communicating with control elements, such as field devices and function blocks within field devices distributed throughout the process plant 16 to perform one or more process control routines to thereby implement desired control of the process plant 16. These process control routines may be continuous process control routines but will be described herein as batch process ...


PUM


Abstract

A data collection and viewing application provides a user interface that allows a user to quickly and easily examine a particular batch process or a batch run, to compare separate batch runs and / or to determine whether the particular batch run deviates from a norm, without having to perform a lot of manual data manipulation. To this end, the user interface provides or creates a compact graphical representation of a batch, illustrating a number of different types of batch-related data in relation to one another in a manner that enables a user to easily view or understand the operation of the batch run, either alone or as compared with one or more other batch runs. Moreover, process alarms, alerts, events, as well as other information may be placed in one or more additional layers, and the various layers may be shown together to provide a compact graphical view of the batch.

Description

FIELD OF TECHNOLOGY[0001]The present invention relates generally to process control networks and, more particularly, to a batch display engine that obtains and displays information regarding batch processes implemented within a process plant.DESCRIPTION OF THE RELATED ART[0002]Process control networks, such as those used in chemical, petroleum or other processes, generally include a centralized process controller communicatively coupled to one or more field devices which may be, for example, valve positioners, switches, sensors (such as temperature, pressure and flow rate sensors), etc. These field devices may perform physical control functions within the process plant (such as opening or closing a valve), may take measurements within the process plant for use in controlling the operation of the process plant or may perform any other desired function within the process plant. Process controllers have historically been connected to field devices via one or more analog signal lines or...

Claims


Application Information

Patent Timeline
Patent Type & Authority Patents(United States)
IPC IPC(8): G06F9/46G06F3/00G06F15/177G06F19/00G06F3/048G05B15/00G05B11/01
CPCG05B19/4183G05B2219/31474G05B2219/31318G05B2219/31288Y02P90/02G05B19/418G06F3/14
Inventor WOREK, CHRISTOPHER J.CAMPNEY, BRUCEIRWIN, WILLIAM G.FELTS, CHRISTOPHER
Owner FISHER-ROSEMOUNT SYST INC
Why Eureka
Try Eureka