
Systems and methods for comparing and improving sales performance over heterogeneous geographical sales regions

a technology of heterogeneous geographical sales and systems, applied in the field of systems and methods for analyzing sales performance, can solve the problems of difficult to compare the performance of each sales area and difficult to determine the appropriate price level, so as to improve sales performance, enhance sales performance, and optimize the controllable sales parameters

Inactive Publication Date: 2010-06-01
VERIZON PATENT & LICENSING INC
View PDF4 Cites 16 Cited by
  • Summary
  • Abstract
  • Description
  • Claims
  • Application Information

AI Technical Summary

Benefits of technology

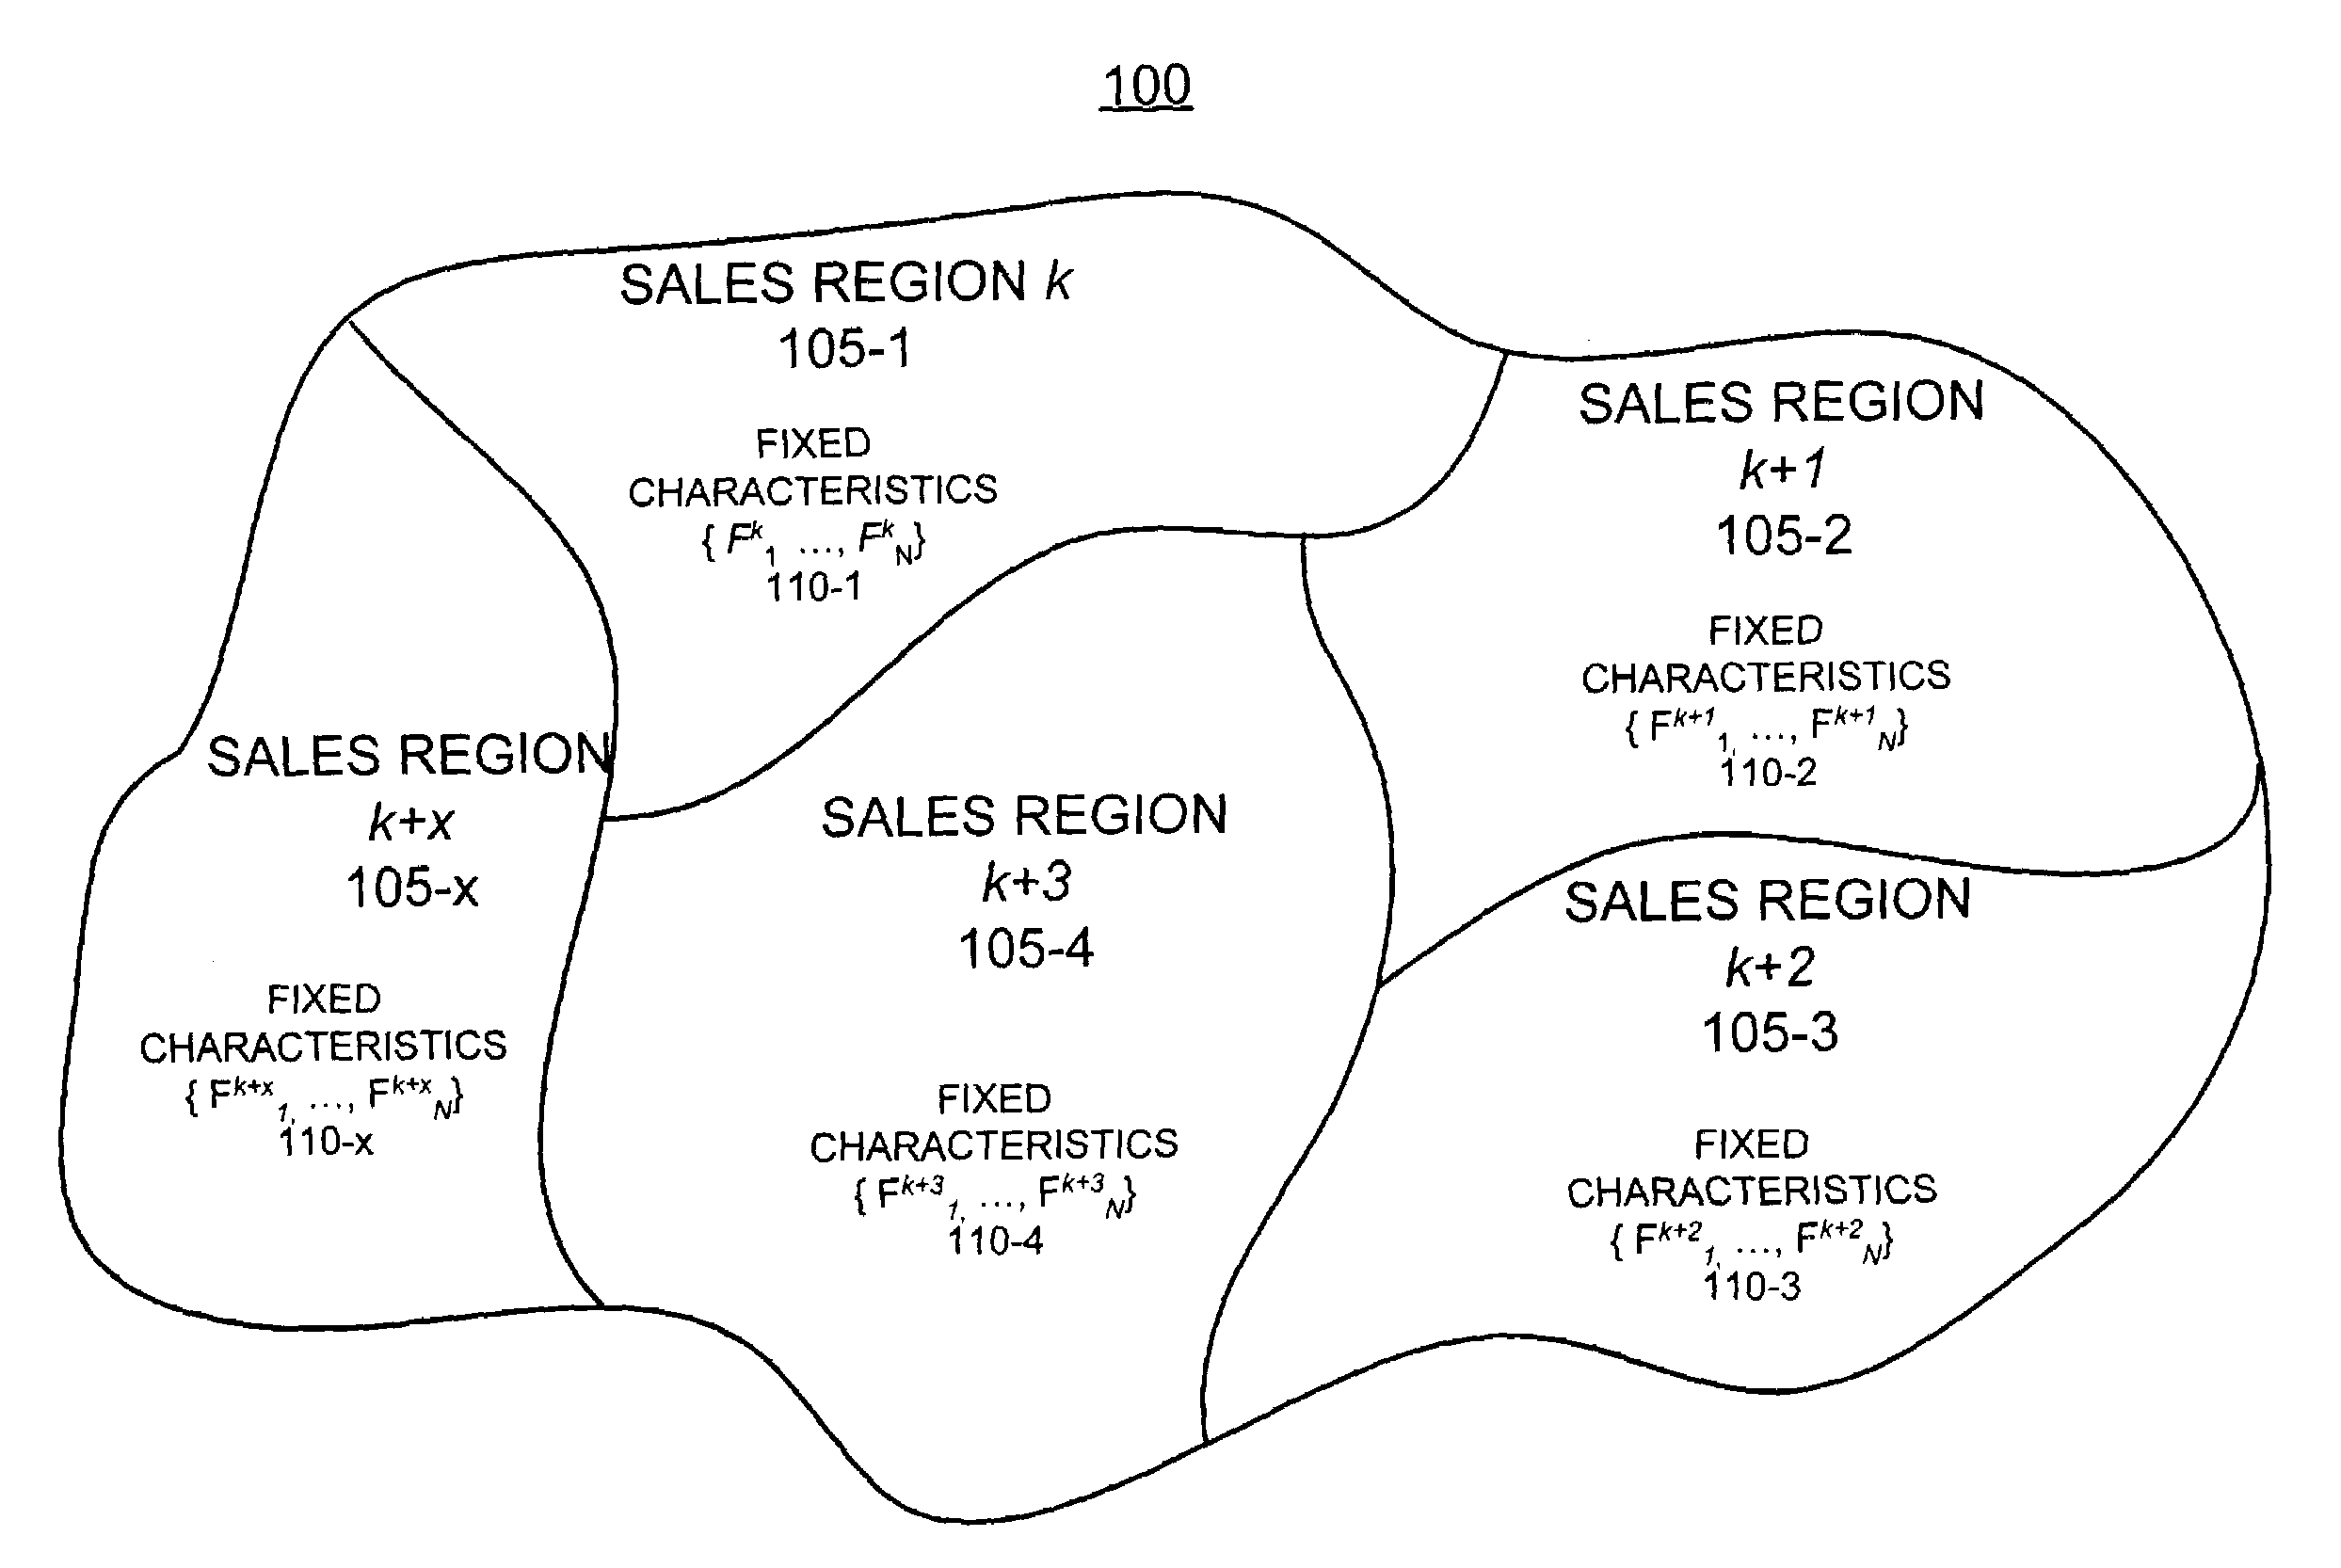
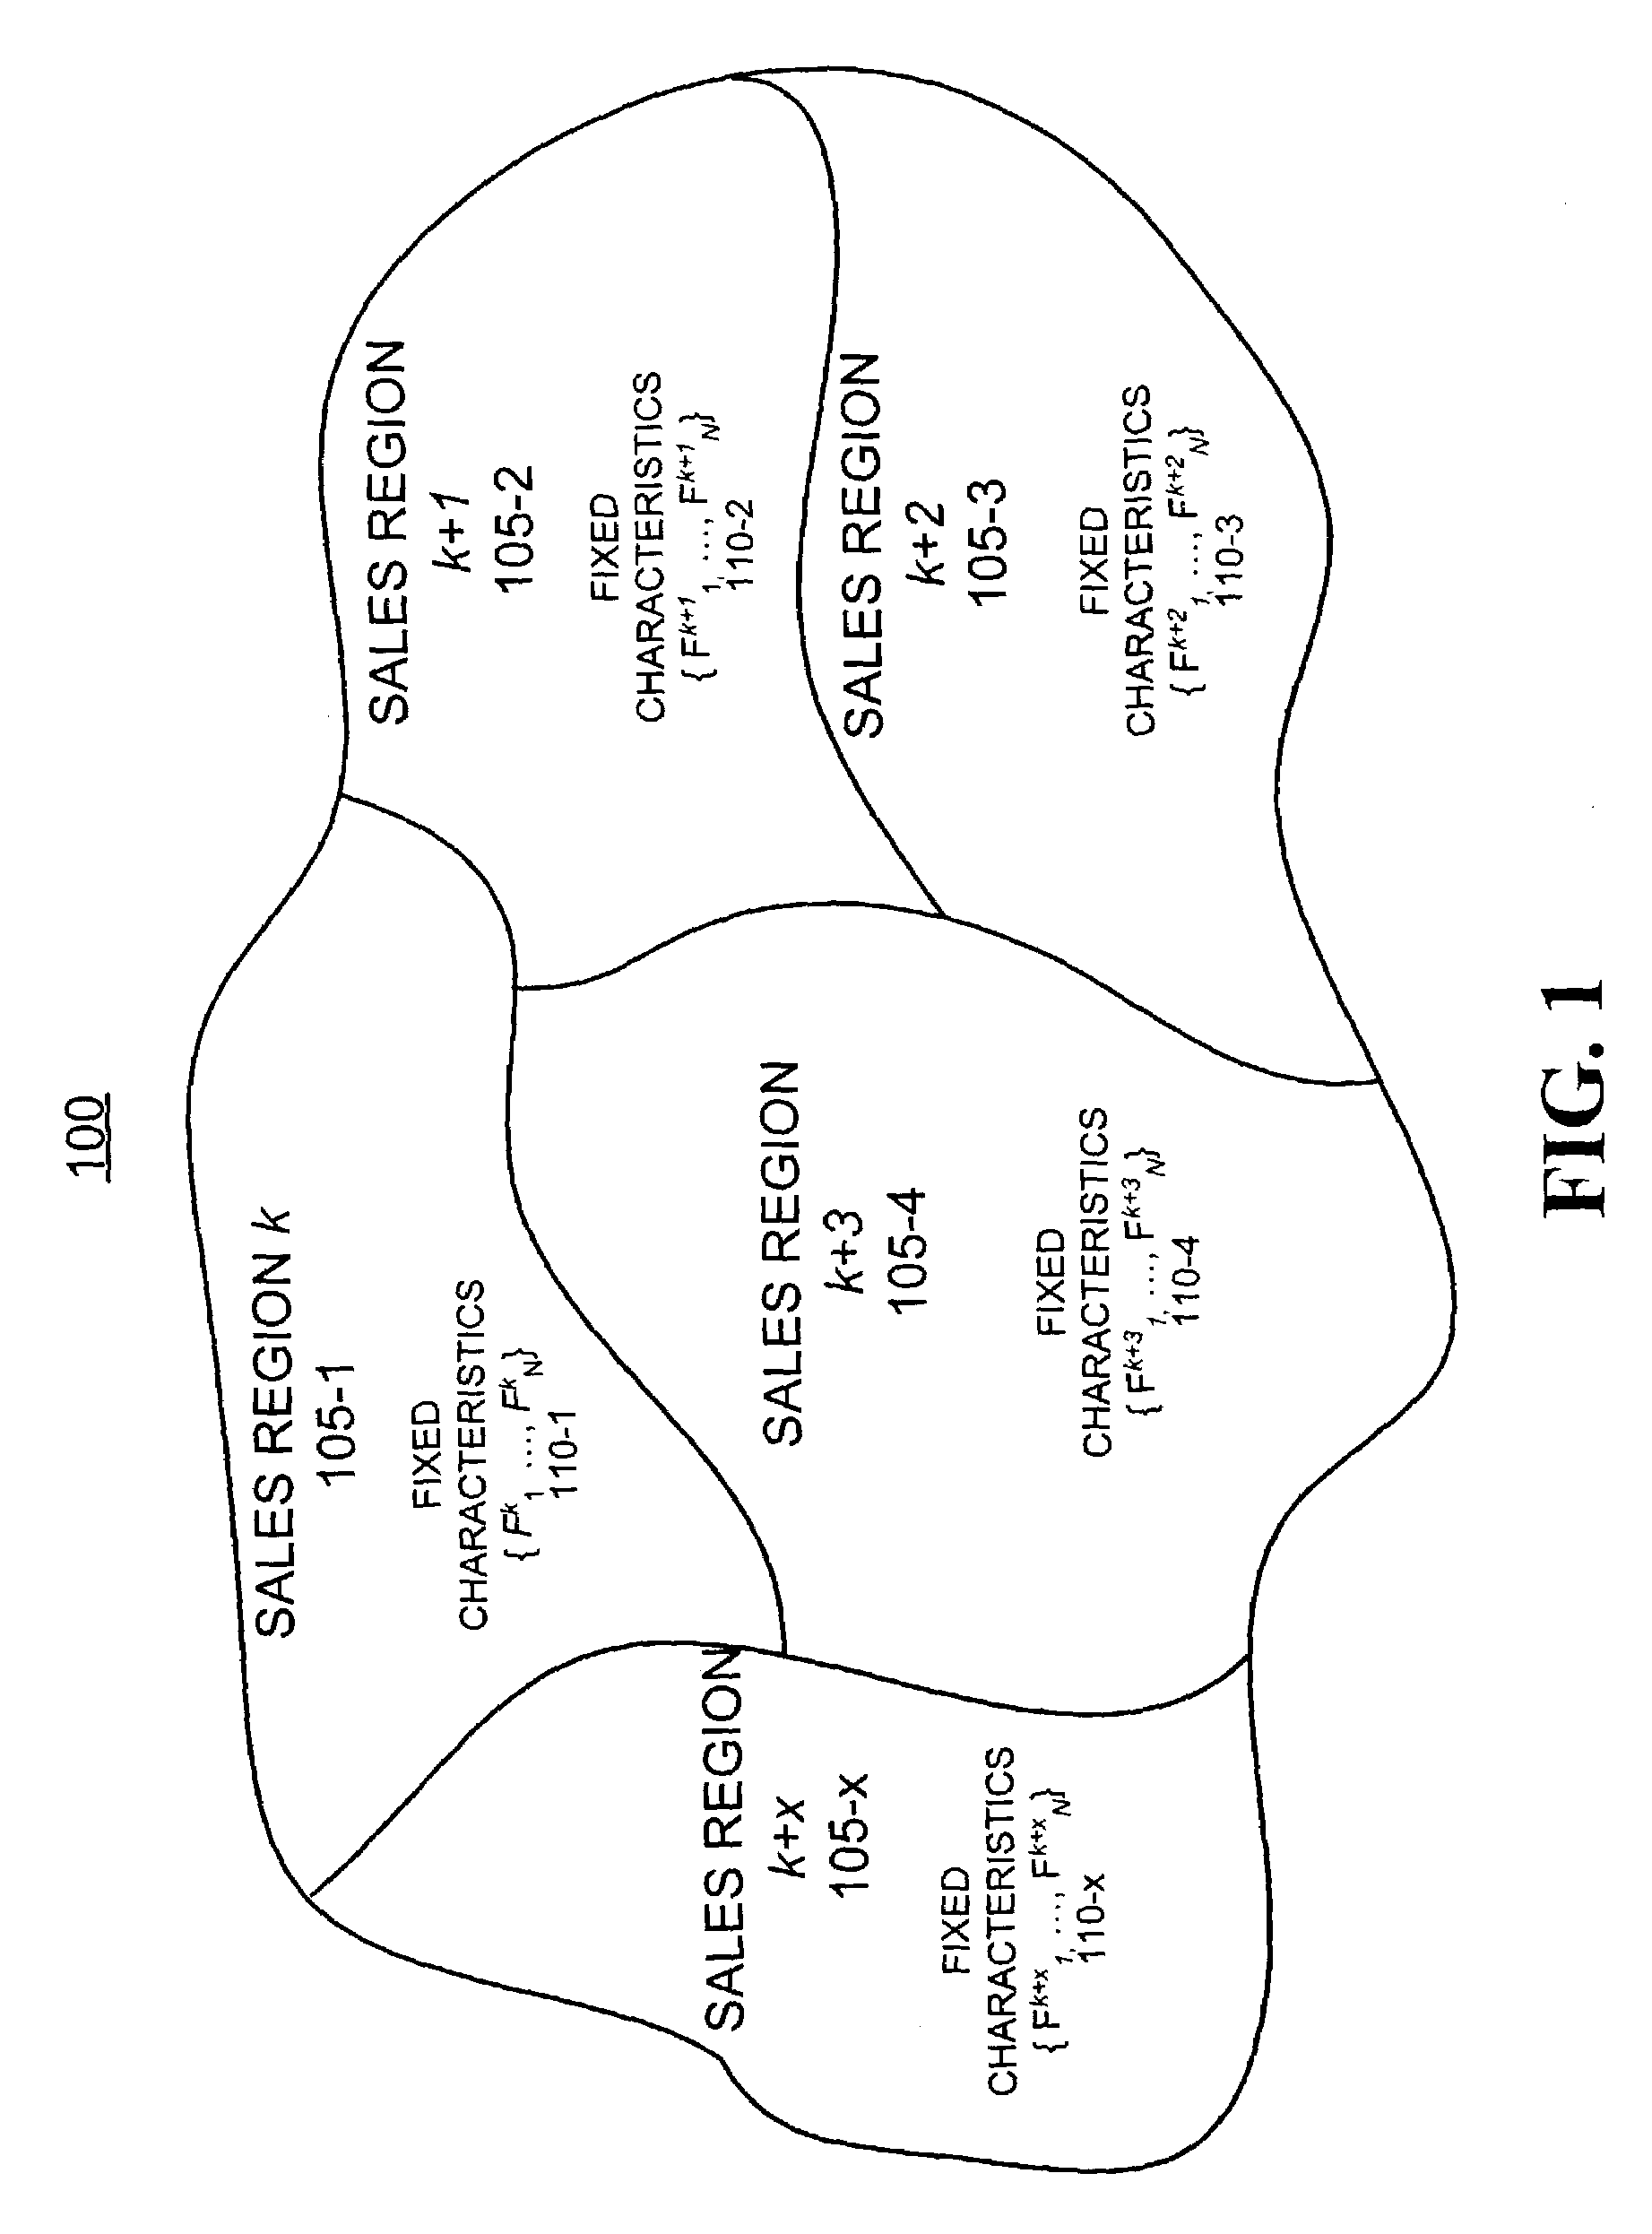
[0004]Systems and methods consistent with the present invention address this and other needs by creating norms for each sales region's revenue performance and norms for controllable sales parameters that take into account the fixed characteristics of the sales area. For example, the norms can be for revenue as well as for controllable sales parameters such as price, sales force size, etc. The ratio of actual values to the norms creates comparable scores. Systems and methods consistent with the invention may use these scores to develop relationships between performance measures (e.g., revenue) and the controllable sales parameters. The developed relationships then provide a means to optimize the controllable sales parameters to improve sales performance. The developed relationships, thus, permit the comparison of the sales performances of multiple sales regions by accounting for the effect of fixed characteristics of each sales region on revenue, and the determination of appropriate target levels for revenue and sales parameters that will enhance sales performance for each sales region.

Problems solved by technology

In businesses that have a large number of small independent geographical sales areas or regions, it can be difficult to compare the performance of each sales area because the characteristics associated with each sales area differ.
These differences make it difficult to determine the appropriate price levels, expected customer penetration level, revenue, and market share for each sales region.

Method used


Image

  • Systems and methods for comparing and improving sales performance over heterogeneous geographical sales regions
  • Systems and methods for comparing and improving sales performance over heterogeneous geographical sales regions
  • Systems and methods for comparing and improving sales performance over heterogeneous geographical sales regions

Examples


Embodiment Construction

[0011]The following detailed description of the invention refers to the accompanying drawings. The same reference numbers in different drawings may identify the same or similar elements. Also, the following detailed description does not limit the invention. Instead, the scope of the invention is defined by the appended claims.

[0012]Systems and methods consistent with the present invention enable the comparison of the sales performances across multiple sales regions by factoring in the effect of fixed characteristics of each sales region on revenue, and determining appropriate target levels for revenue and sales parameters for each of the sales regions. Thus, the sales performance of multiple sales regions may account for the effect of fixed characteristics such as, for example, population, number of households, geographic size, number of retail businesses, average income of residents, cost of living, number of competitors, and size of competitors. Logged models for revenue and sales...


PUM


Abstract

A method of improving sales performance over multiple geographical sales regions includes determining (305) characteristics of each of the geographical sales regions and determining sales parameters, over which control can be exercised, for each of the sales regions. The method further includes modeling (310, 315, 320, 405) each of the sales regions based on the determined characteristics and sales parameters to create a model and determining (410), using the model, scores for sales parameters and revenue for each of the sales regions that allow direct comparison between each of the sales regions. The method also includes comparing (415) the scores for each of the sales regions to determine how to adjust the sales parameters to increase revenue for each of the sales regions.

Description

FIELD OF THE INVENTION[0001]The present invention relates generally to systems and methods for analyzing sales performance and, more particularly, to systems and methods for comparing and improving sales performance over heterogeneous geographic sales regions.BACKGROUND OF THE INVENTION[0002]In businesses that have a large number of small independent geographical sales areas or regions, it can be difficult to compare the performance of each sales area because the characteristics associated with each sales area differ. Examples of these characteristics are population, geographic size, number of businesses, cost of living, employment, and number and size of competitors. These differences make it difficult to determine the appropriate price levels, expected customer penetration level, revenue, and market share for each sales region. In most cases, the only benchmarks are historical performance, which may or may not be good, or indices such as sales per person, which ignore the characte...

Claims


Application Information

Patent Timeline
Patent Type & Authority Patents(United States)
IPC IPC(8): G06F9/44
CPCG06Q10/063G06Q30/0205G06Q30/02
Inventor TOBIN, ROGER L.
Owner VERIZON PATENT & LICENSING INC
Learn More