
Automatic rules driven data visualization selection

a data visualization and automatic selection technology, applied in the field of automatic rules driven data visualization selection, can solve the problems of reducing the flexibility of software packages, difficult or cumbersome for users to select which visualizations, and interested in the process of identifying

Active Publication Date: 2009-10-20
ORACLE INT CORP
View PDF6 Cites 19 Cited by
  • Summary
  • Abstract
  • Description
  • Claims
  • Application Information

AI Technical Summary

Benefits of technology

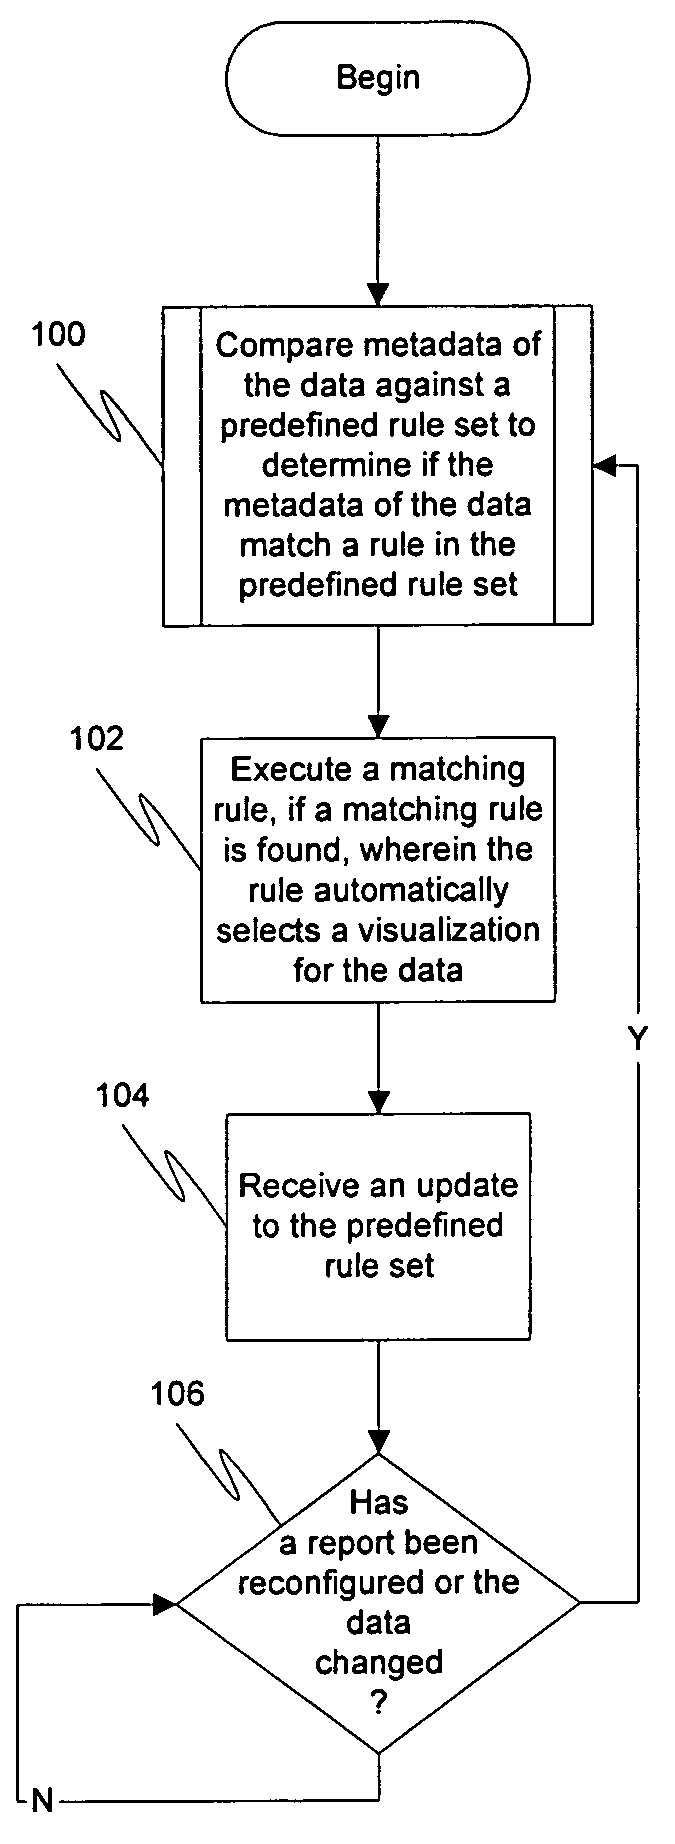
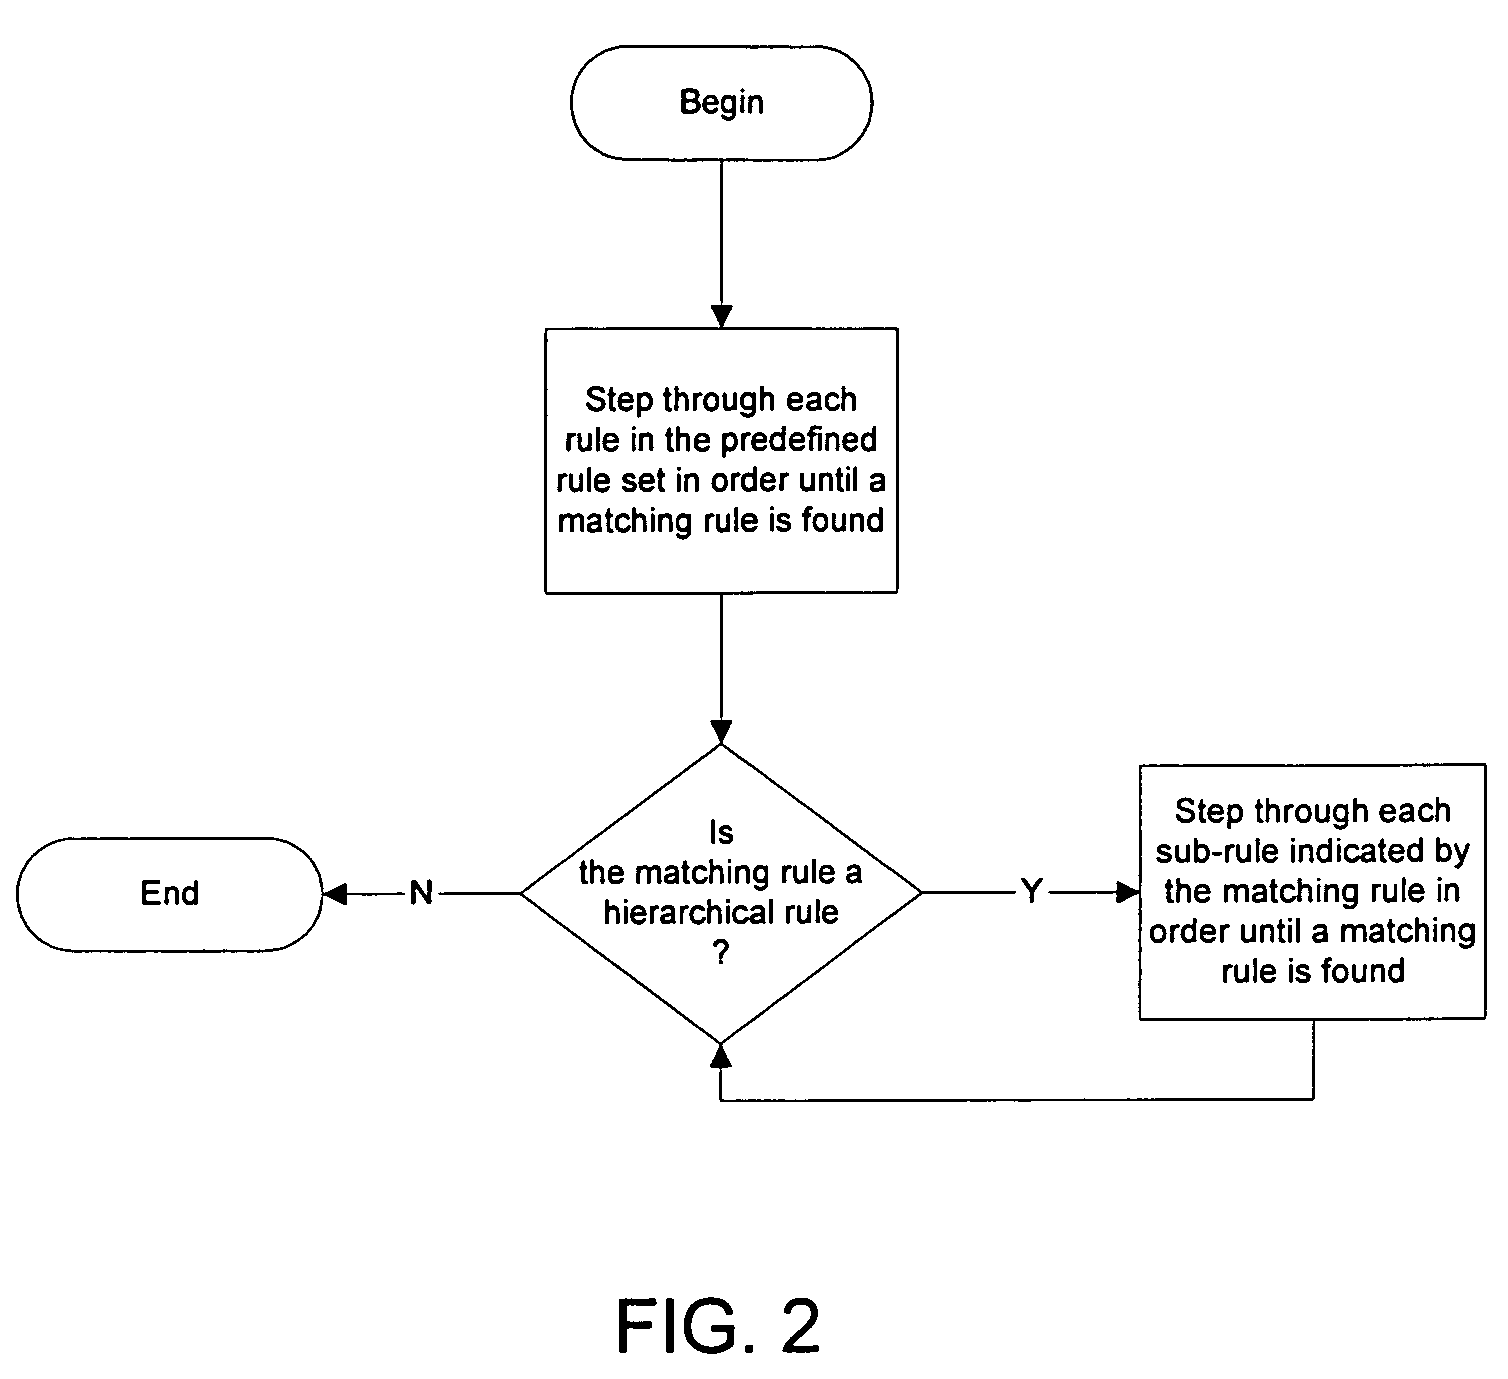
The patent describes a system that automatically decides which type of visualization is best for showing specific data. This is done by using a rules-based system that analyzes the data and its properties, and checks it against pre-defined rules. Based on these rules, the system selects the best visualization and option combination to use. This makes it easier for users to quickly find the most suitable way to display data.

Problems solved by technology

While this provides flexibility to the user in choosing various visualizations, it can sometimes be difficult or cumbersome for the user to select which visualization to use and which options to select.
While this puts less burden on the user to select a chart, it also obviously reduces the flexibility of the software package.
However, they are not interested in the process of identifying what form of visualization is best suited for their data.

Method used


Image

  • Automatic rules driven data visualization selection
  • Automatic rules driven data visualization selection
  • Automatic rules driven data visualization selection

Examples


Embodiment Construction

[0012]Embodiments of the present invention are described herein in the context of a system of computers, servers, and software. Those of ordinary skill in the art will realize that the following detailed description of the present invention is illustrative only and is not intended to be in any way limiting. Other embodiments of the present invention will readily suggest themselves to such skilled persons having the benefit of this disclosure. Reference will now be made in detail to implementations of the present invention as illustrated in the accompanying drawings. The same reference indicators will be used throughout the drawings and the following detailed description to refer to the same or like parts.

[0013]In the interest of clarity, not all of the routine features of the implementations described herein are shown and described. It will, of course, be appreciated that in the development of any such actual implementation, numerous implementation-specific decisions must be made in...


PUM


Abstract

A solution is provided that automatically decides what visualization is best suited to present specified data. This is accomplished using a rules-based system that determines the type and properties of a visualization based on data and its corresponding metadata. The data and metadata may be checked against one or more rules, and depending upon which rule or rules match, a corresponding visualization and option combination may be utilized.

Description

[0001]The present invention relates to the field of computer data. More specifically, the present invention relates to the automatic rule driven selection of a visualization of data.BACKGROUND OF THE INVENTION[0002]Many business software charting packages exist to allow users to easily create and display data in visual forms. Some common visual forms include pie charts, line charts, bar charts, bubble charts, radar charts, etc. Typically the way these packages work is that the user specifies certain data, and then manually specifies the chart type and any options that may be needed to use that chart type to present the data. For example, the user may select a series of income-related transactions, indicate that he wants to see a line chart, and then indicate that the line chart should display total income per month. While this provides flexibility to the user in choosing various visualizations, it can sometimes be difficult or cumbersome for the user to select which visualization to...

Claims


Application Information

Patent Timeline
Patent Type & Authority Patents(United States)
IPC IPC(8): G06F17/30
CPCG06Q10/10
Inventor LAASER, WILLIAM TAYLORDEARDEN, NICHOLAS PHILIPMACNARY, TIMOTHY GLENN
Owner ORACLE INT CORP
Learn More