
Displaying arbitrary relationships in a tree-map visualization

a tree-map and relationship technology, applied in the field of data visualization, can solve the problem of limited repeating steps

Inactive Publication Date: 2009-10-20
IBM CORP
View PDF28 Cites 85 Cited by
  • Summary
  • Abstract
  • Description
  • Claims
  • Application Information

AI Technical Summary

Problems solved by technology

Furthermore, the repeating step can be limited to those nodes which are within a specified number of generations from the node for which the proximity event has been detected.

Method used


Image

  • Displaying arbitrary relationships in a tree-map visualization
  • Displaying arbitrary relationships in a tree-map visualization
  • Displaying arbitrary relationships in a tree-map visualization

Examples


Embodiment Construction

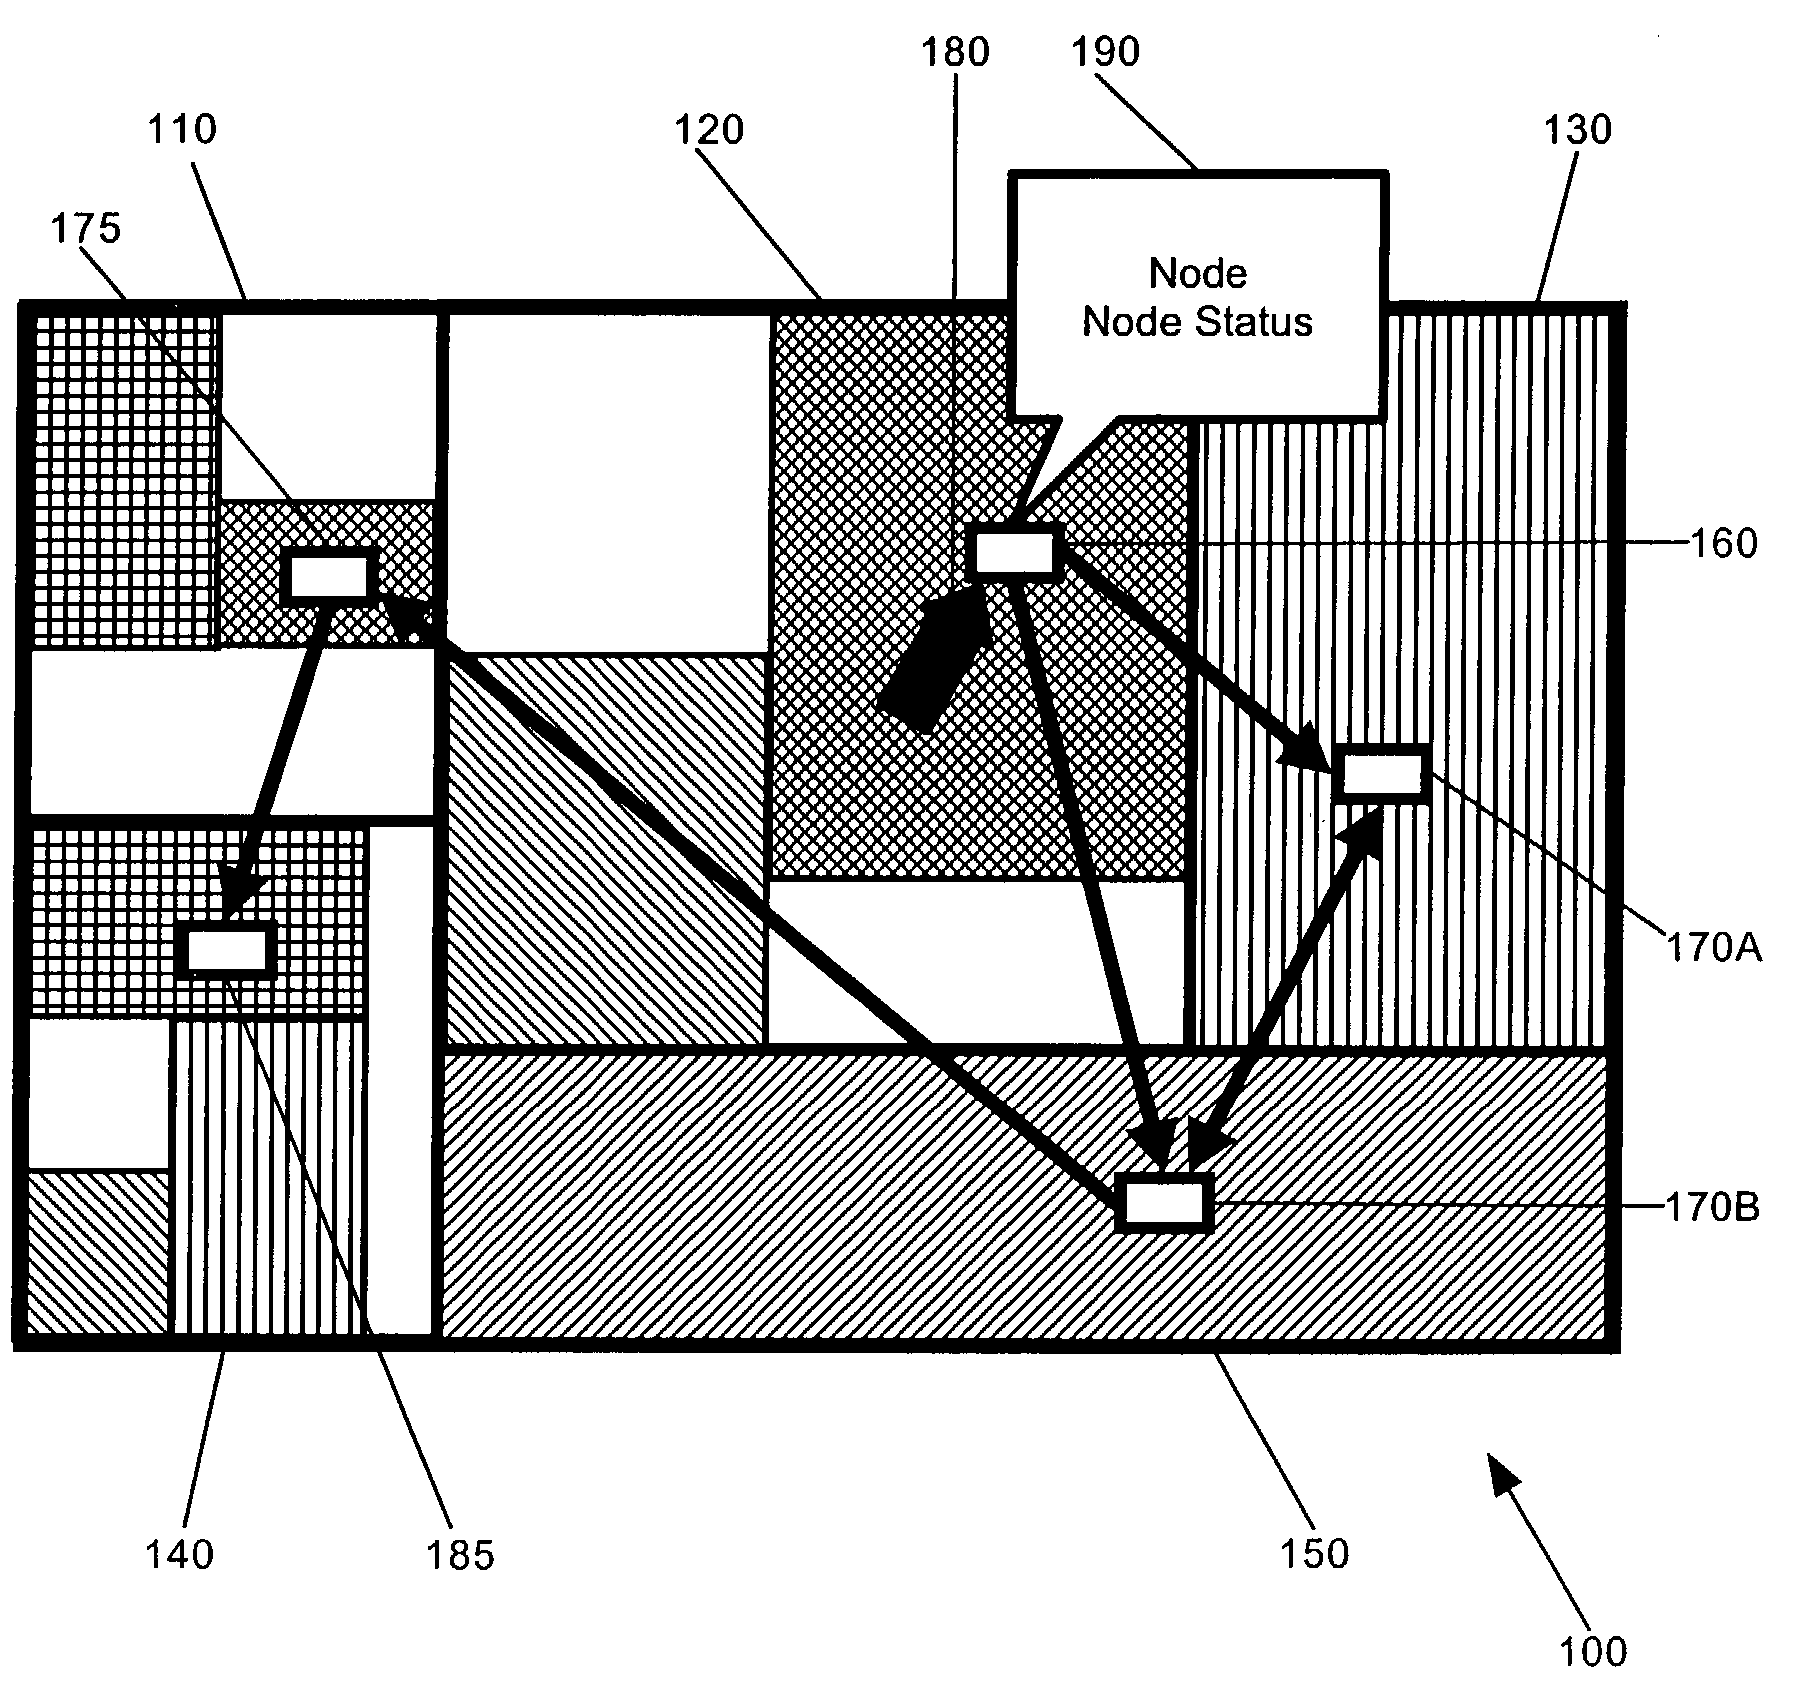
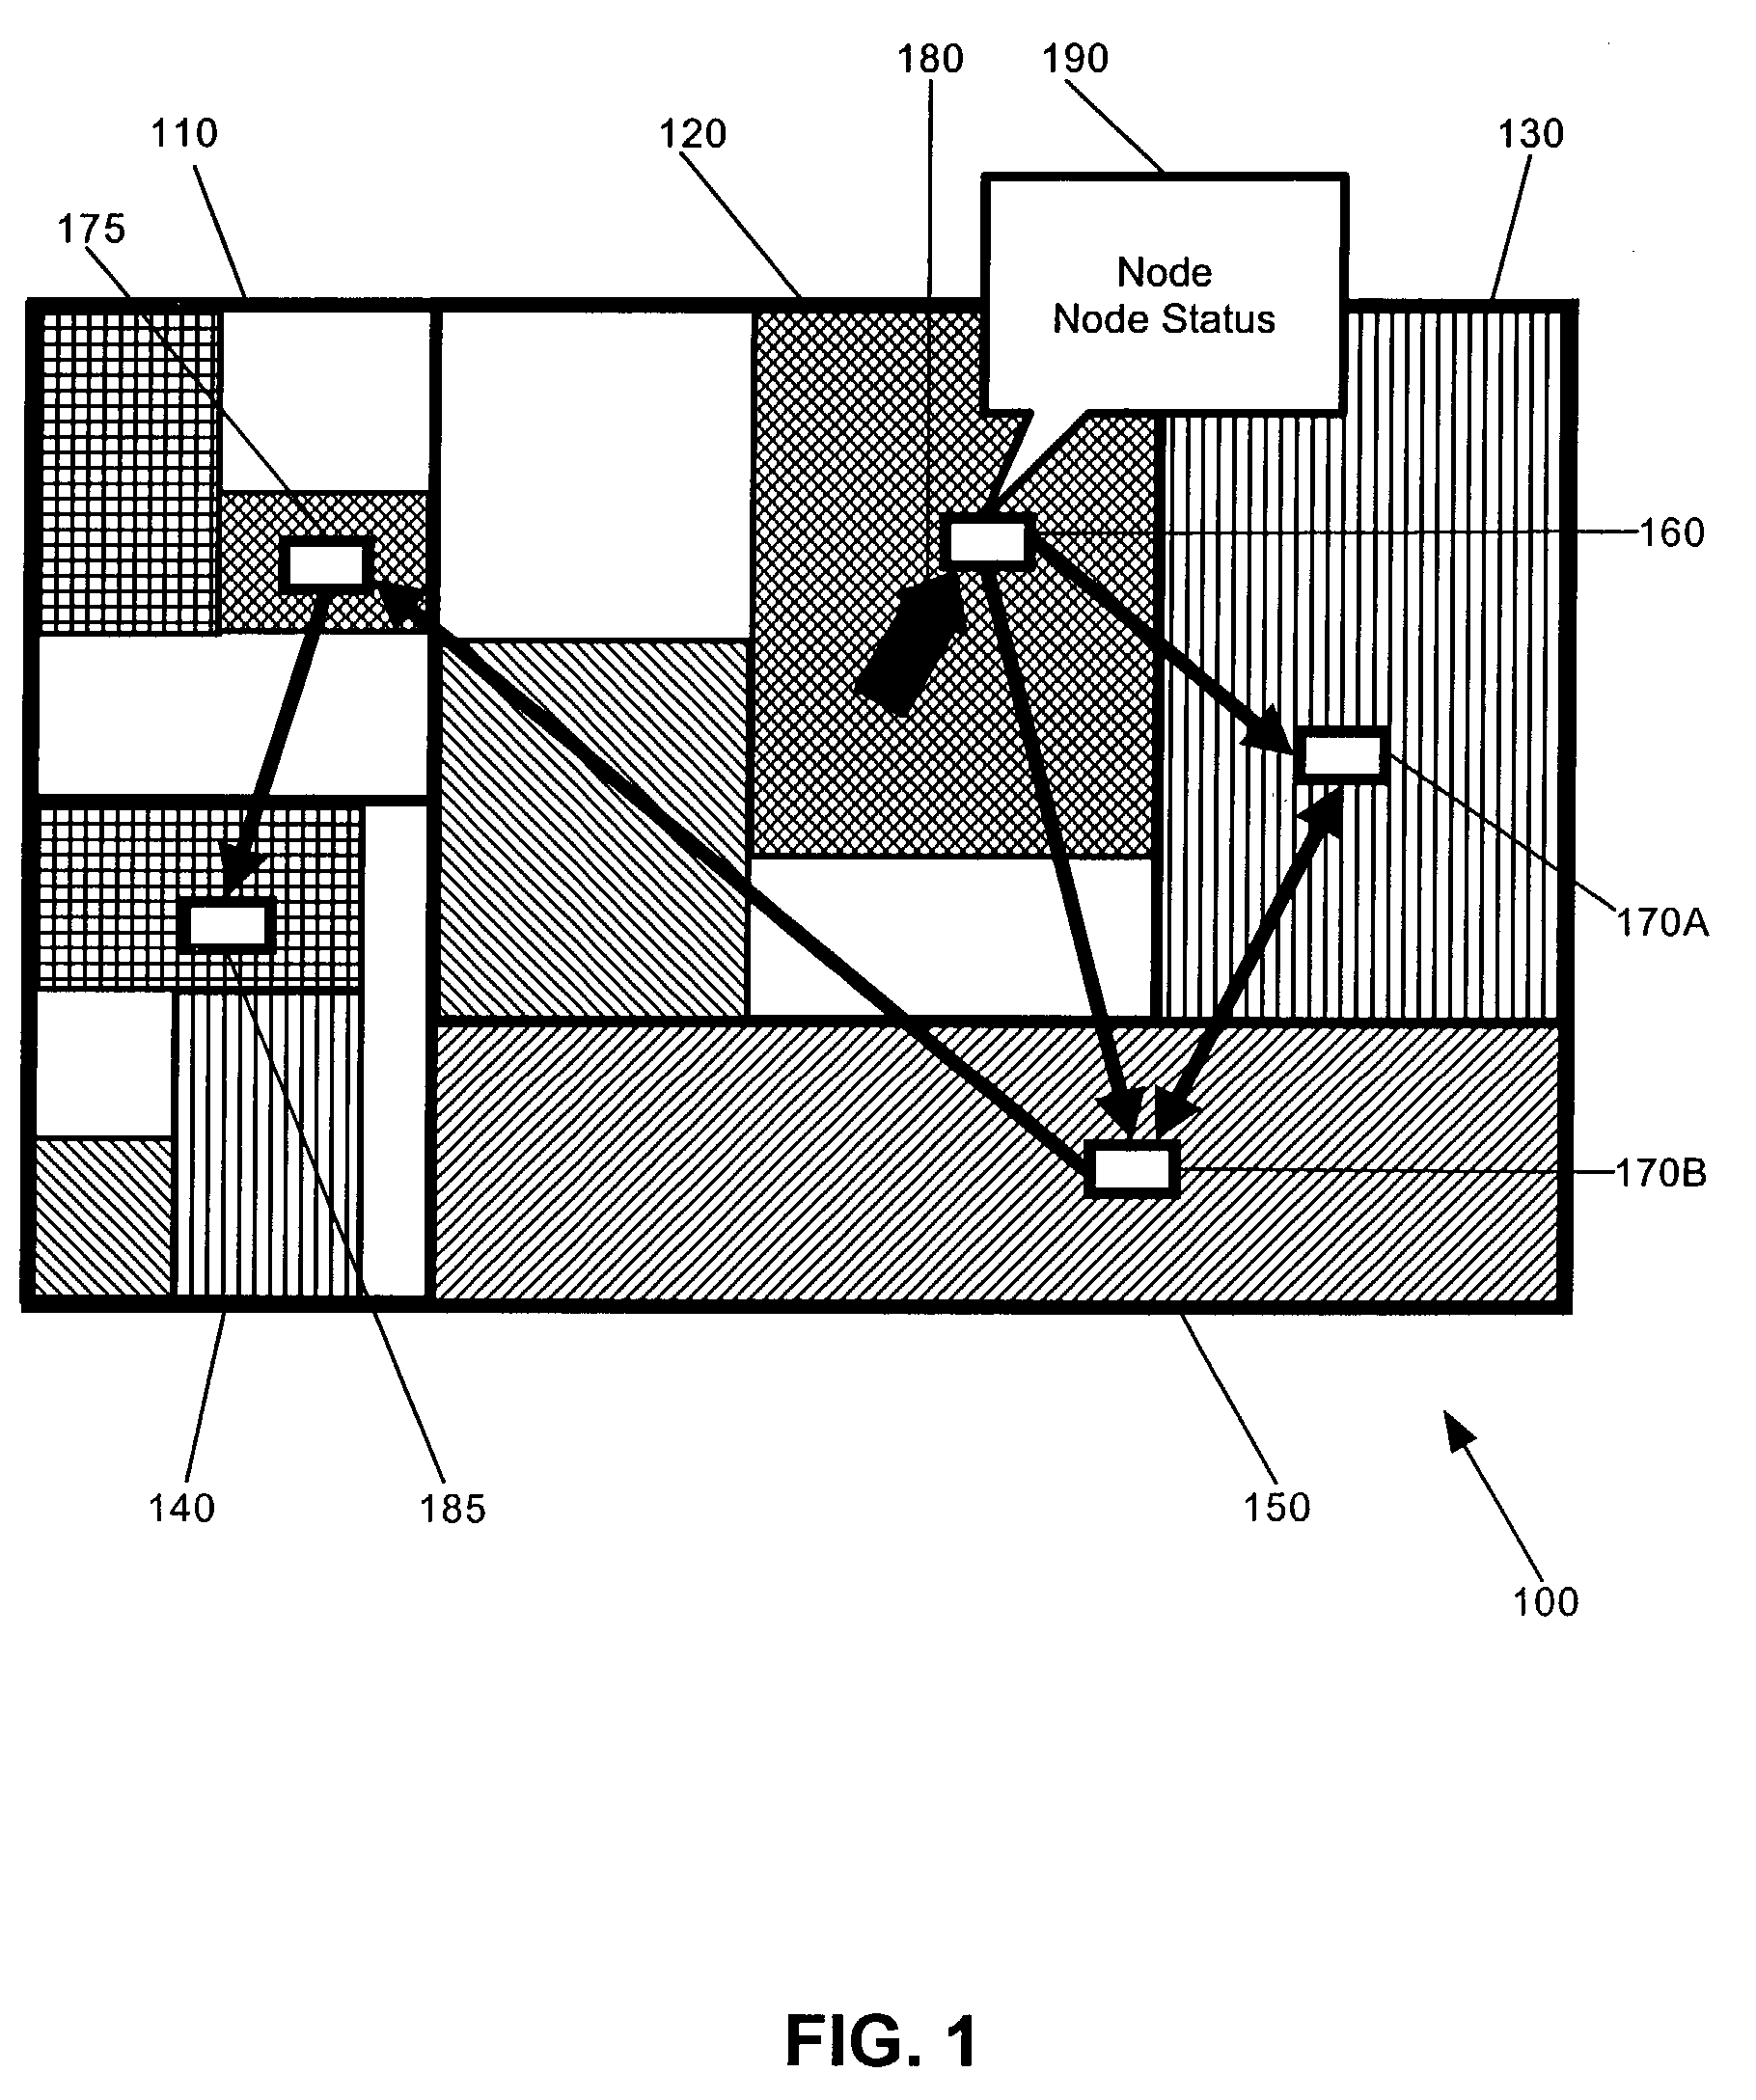
[0017]The present invention is a system, method and apparatus for displaying aribtrary relationships in a tree-map visualization. Whenever a node in the tree-map receives interest, such as when a mouse pointer passes in proximity to the node of interest, all other nodes with which it has inter-connected relationships will be highlighted, and lines drawn between them conveying the direction of the relationship. In this way, the inter-relationship between the node of interest and other nodes in the tree-map can be visually recognized by one observing the tree-map of the present invention.

[0018]FIG. 1 is pictorial illustration of a tree-map visualization which has been configured in accordance with the inventive arrangements. The tree-map 100 can include a multiplicity of nested nodes 110, 120, 130, 140, 150, which can include a composition of one or more additionally nested nodes, which additionally can include further nested nodes, and so forth, such as the nodes 160, 170A, 170B, 175...


PUM


Abstract

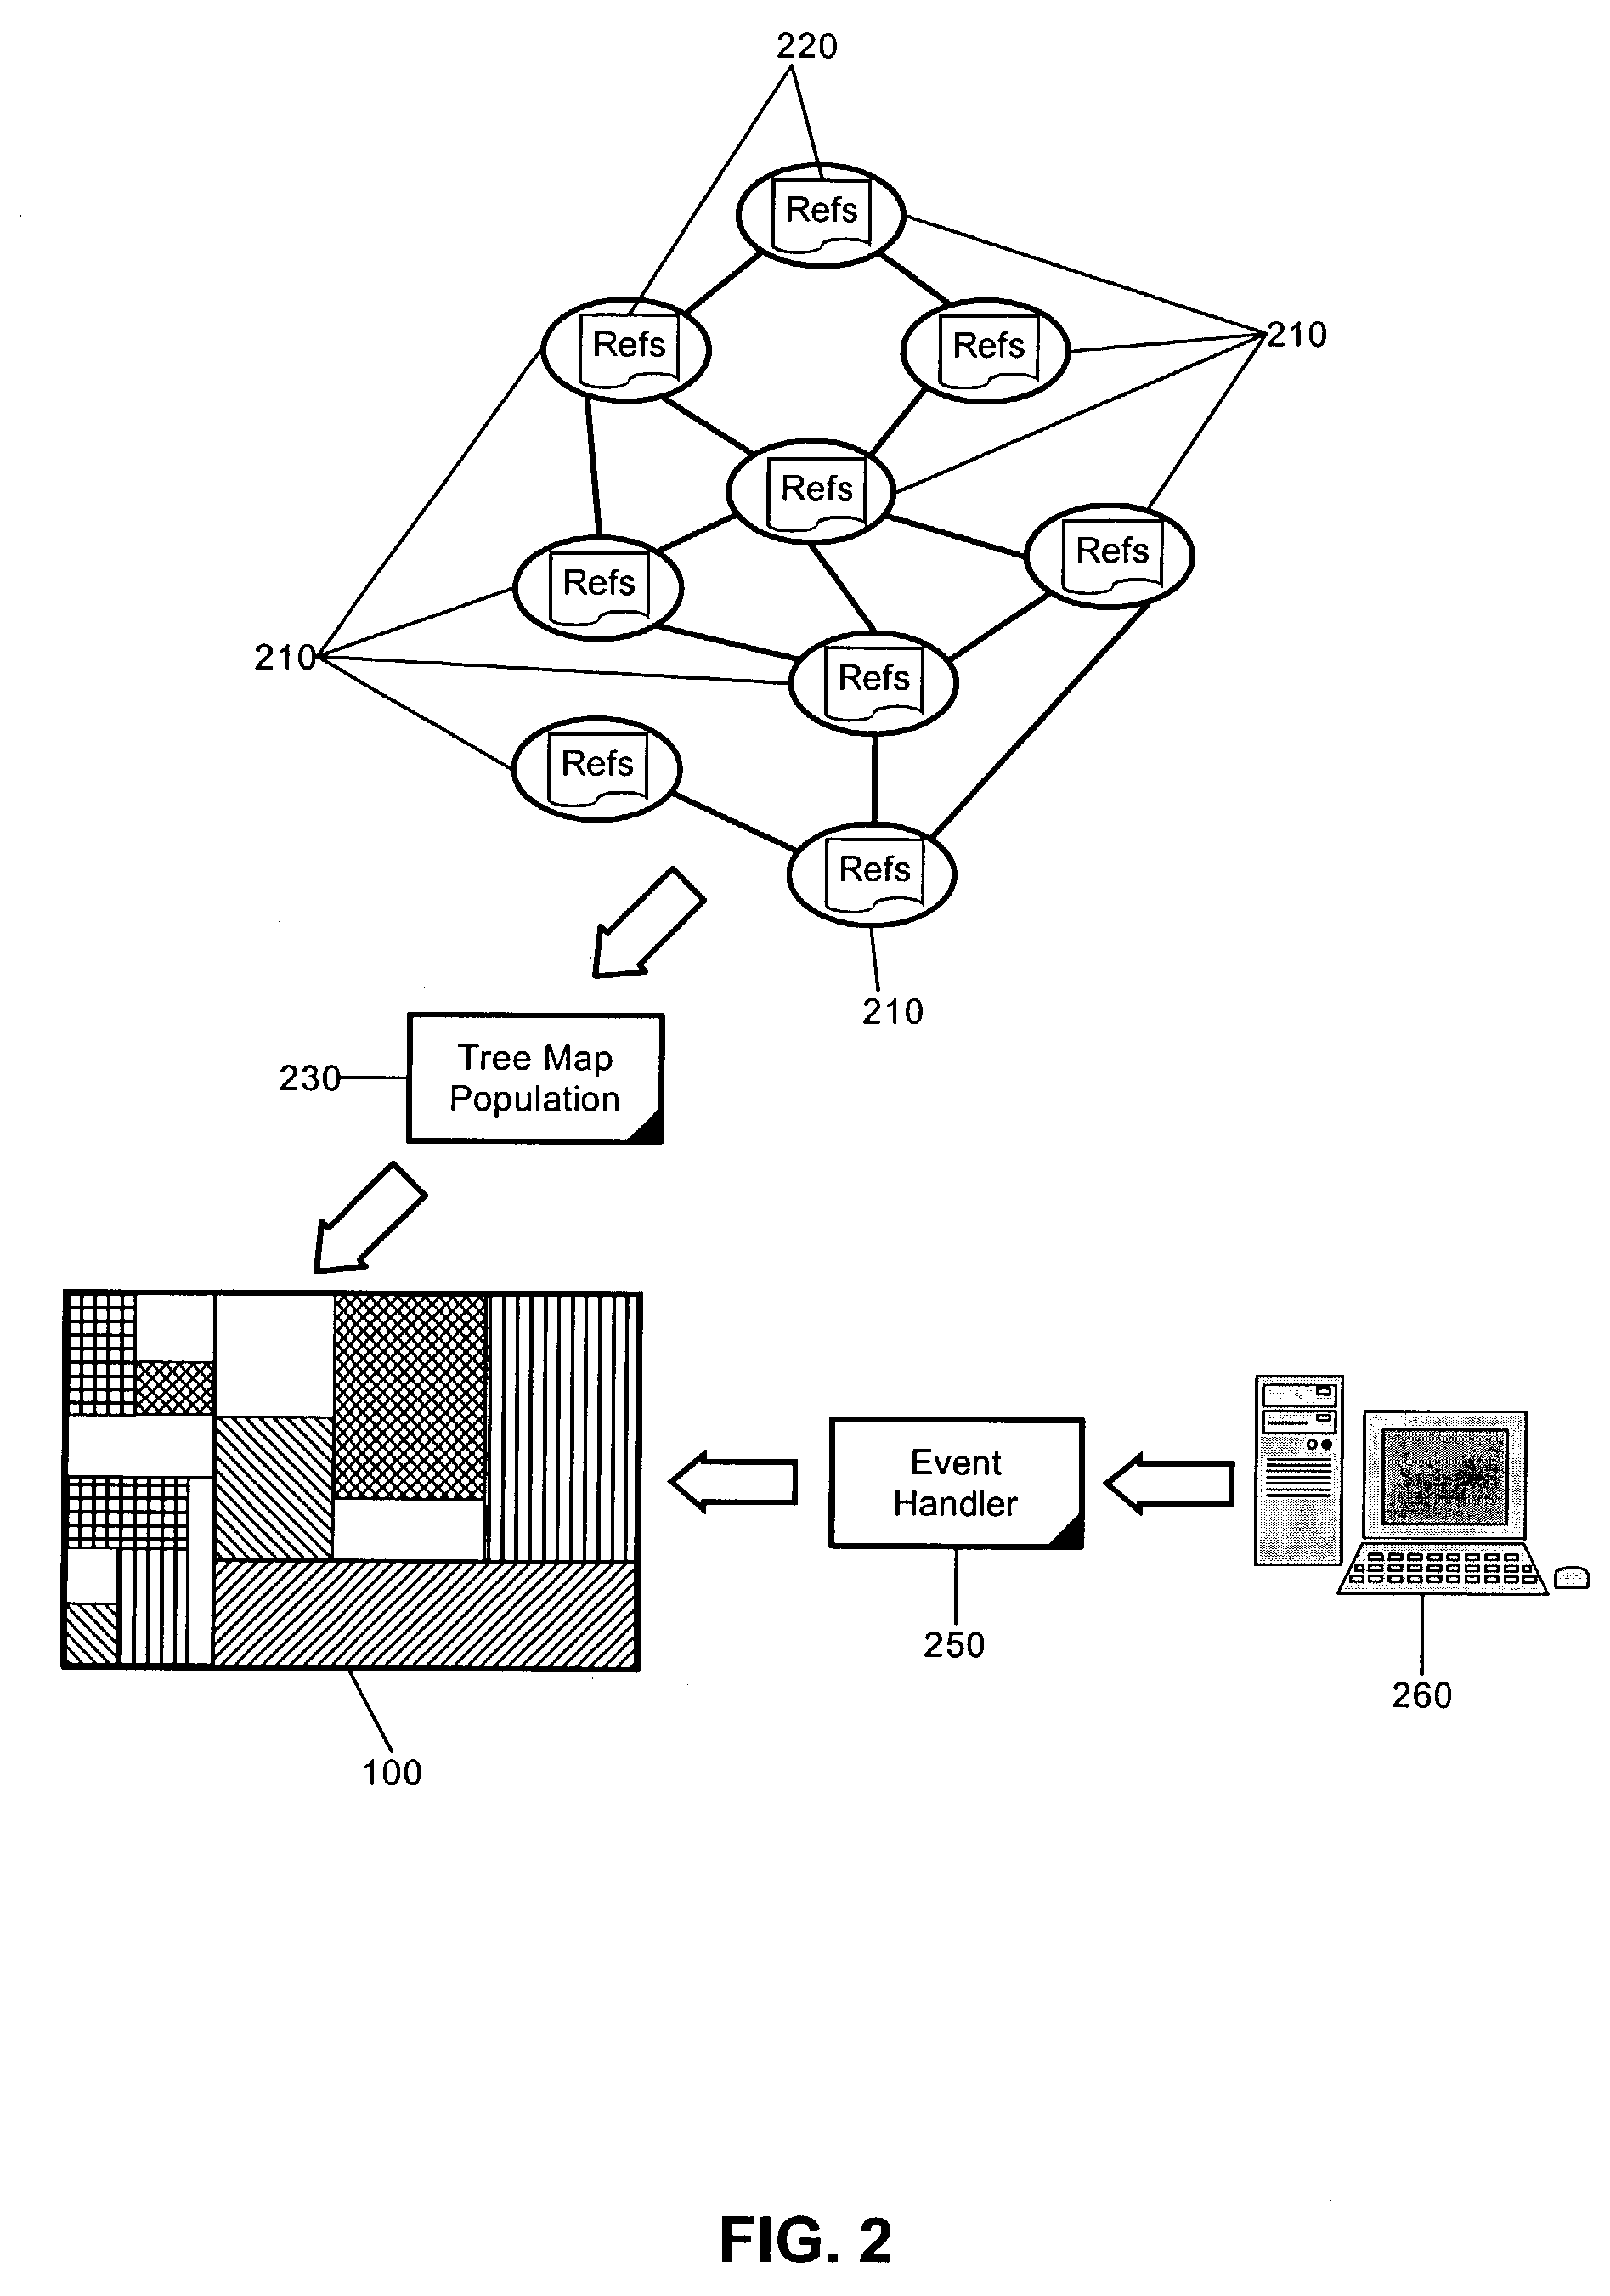
A treemap visualization system can include a treemap configured to visualize a set of nodes. The treemap visualization system also can include an event handler programmed to process a proximity event associated with a specific portion of the treemap. The event handler can process the proximity event by visually coupling selected nodes which are inter-related to a node associated with the proximity event. The system further can include logic for displaying a direction for each inter-relationship between the selected nodes and the node associated with the proximity event. In this regard, the proximity event can include a mouse-over event, a mouse-click event, and a keyboard selection event.

Description

BACKGROUND OF THE INVENTION[0001]1. Statement of the Technical Field[0002]The present invention relates to the field of data visualization and more particularly, to tree-map visualization.[0003]2. Description of the Related Art[0004]As computer technology advances, computing systems have undertaken the management and processing of even larger data systems. With data systems ranging from massive standalone databases to vast distributed networks, oftentimes the limiting factor in analyzing the state of a given system rests not with computing resources, but with the human operator. Specifically, though the computing system may aggregate vast quantities of data in near real-time, in the end, a human being must visualize the compilation of data to draw effective conclusions from the visualization. Yet, the ability of the end user to digest compiled information varies inversely with the amount of data presented to the end user. Where the amount of compiled data becomes excessive, it can b...

Claims


Application Information

Patent Timeline
Patent Type & Authority Patents(United States)
IPC IPC(8): G06T11/20
CPCG06T11/206
Inventor UTHE, ROBERT THOMAS
Owner IBM CORP
Learn More