
Signal processing using non-linear regression with a sinusoidal model

a nonlinear regression and signal processing technology, applied in the field of signal processing methods, can solve the problems of requiring expensive technology, unable to obtain both the high spatial resolution needed to see small vessels and the small frequency shifts needed to quantify, and the frequency domain is limited by the inverse duality, so as to achieve high spatial resolution and reduce the cost of the system and method. , the effect of high frequency resolution

Inactive Publication Date: 2009-08-11
NORTHWESTERN UNIV
View PDF2 Cites 44 Cited by
  • Summary
  • Abstract
  • Description
  • Claims
  • Application Information

AI Technical Summary

Benefits of technology

[0008]In accordance with the present invention, the disadvantages of prior signal processing techniques for processing signals such as an optical coherence tomography signal, have been overcome. With the method of the present invention, both high spatial resolution and high frequency resolution are obtained with less sophisticated instrumentation so as to provide a lower cost system and method. Although, the invention is described below for processing an optical coherence tomography (OCT) signal, the method of the present invention is not limited thereto. The method is applicable to the processing of other signals where the frequency of the signal is in a known range.
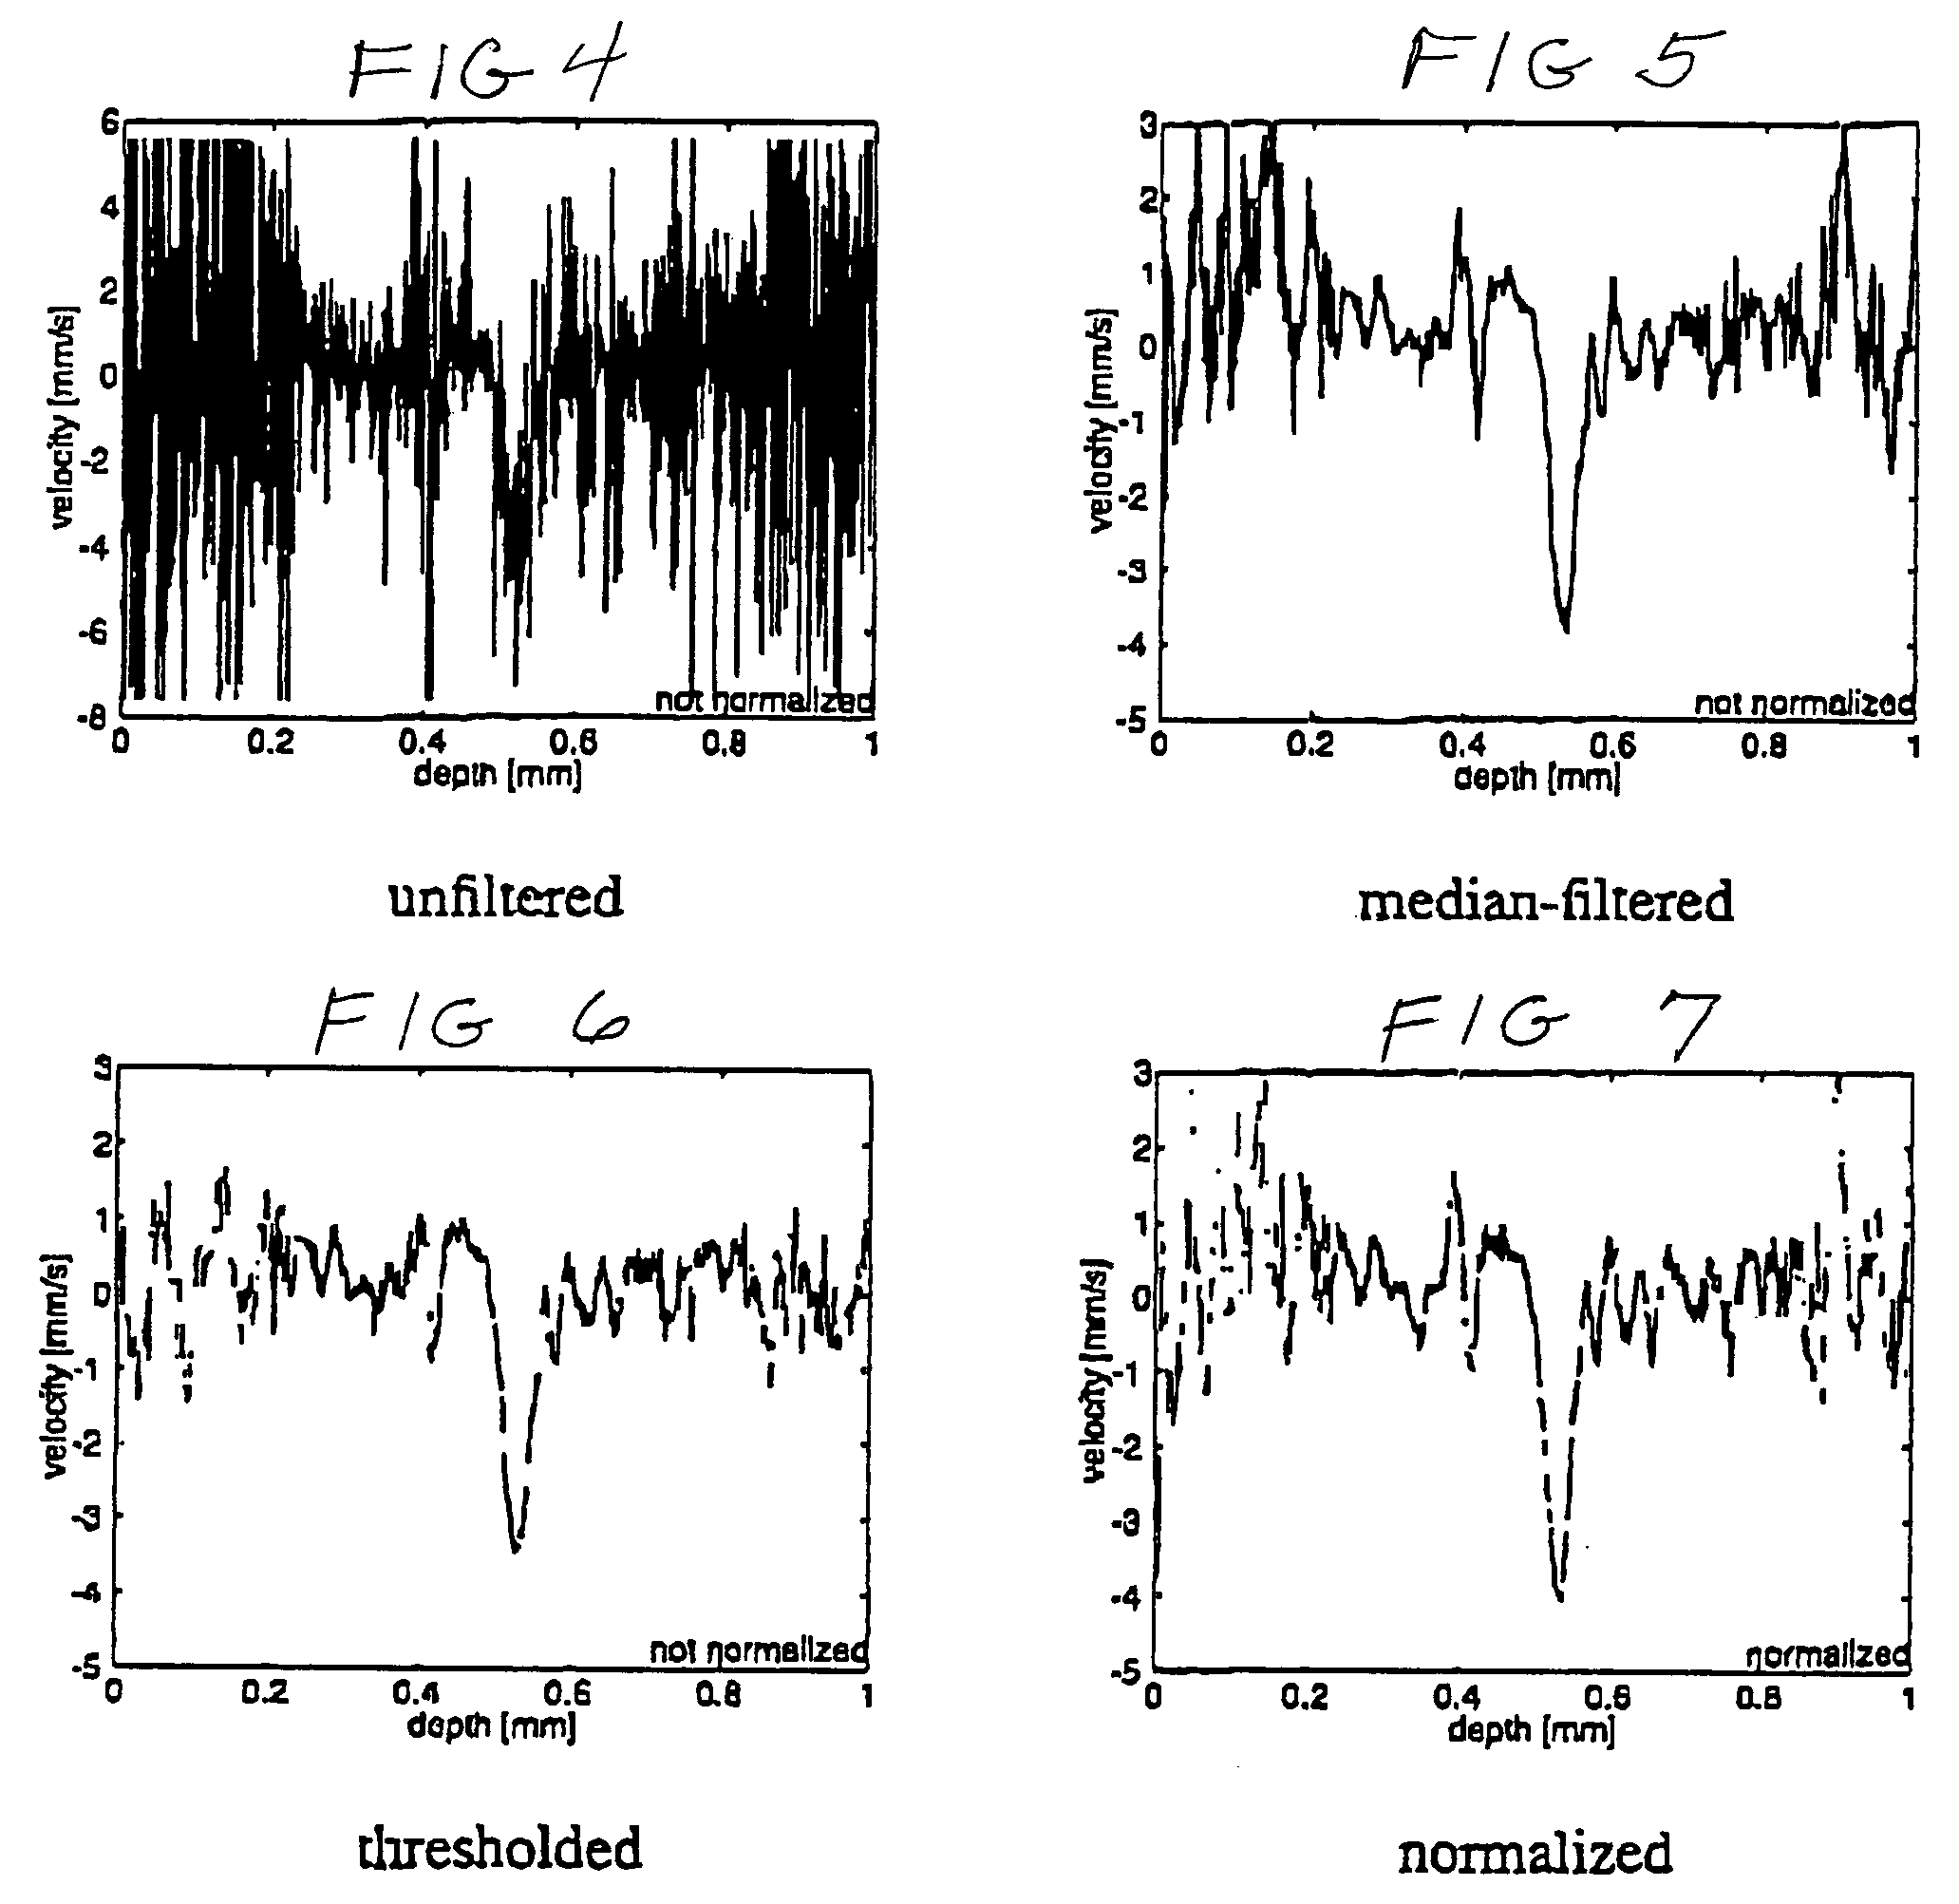
[0010]In one embodiment of the present invention, the digital data points that are processed represent a portion of the signal that is less than a full cycle of a wave of the signal. As a result, higher spatial resolution is obtained. In accordance with the processing method of the present invention, a single A-scan can provide good images. The quality of the images can be improved by using only a few overlapping A-scans as opposed to averaging of a large number of A-scans as in the prior art. Thus, with the method of the present invention, turbulent flow in small vessels can be imaged from data collected in a short period of time.

Problems solved by technology

However, the frequency domain is limited by the inverse duality of spatial resolution and frequency resolution.
Thus, with processing in the frequency domain, one cannot obtain both the high spatial resolution needed to see small vessels and the small frequency shifts needed to quantify the low fluid velocities in such vessels.
In order to overcome this problem, known optical coherence tomography method have averaged a large number of A-scans, which requires expensive technology.

Method used


Image

  • Signal processing using non-linear regression with a sinusoidal model
  • Signal processing using non-linear regression with a sinusoidal model
  • Signal processing using non-linear regression with a sinusoidal model

Examples


Embodiment Construction

[0019]The signal processing system of the present invention focuses on a small section of a complex signal, such as an OCT signal, and models this small section of the signal as a single sine wave for time domain processing. This is opposed to prior methods using frequency domain processing of OCT signals that sample multiple sine waves of multiple frequencies, amplitudes, and phases. The time domain processing method of the present invention is described in detail below for an OCT signal, but the method is not limited thereto. The signal processing method of the present invention can be used for signals, the frequency of which is known within a given range. The size of the frequency range, within which the frequency sought is known to be, varies depending on the signal to noise ratio such that the higher the signal to noise ratio, the greater the frequency range can be.

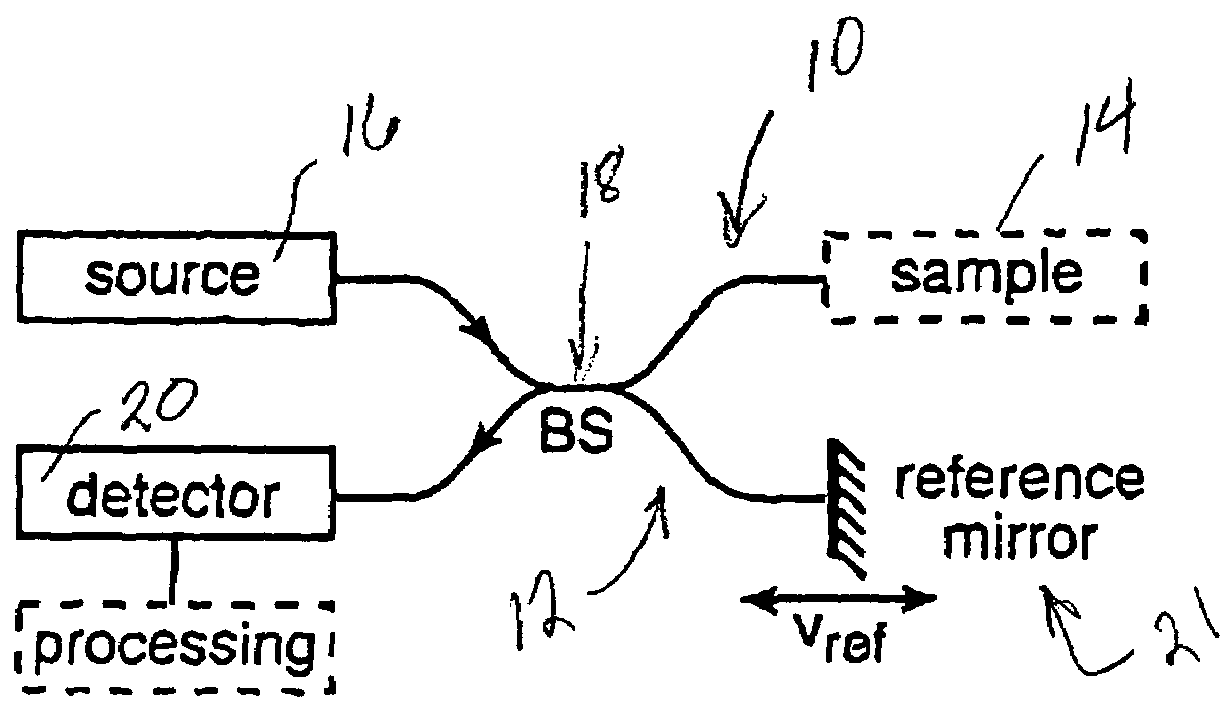
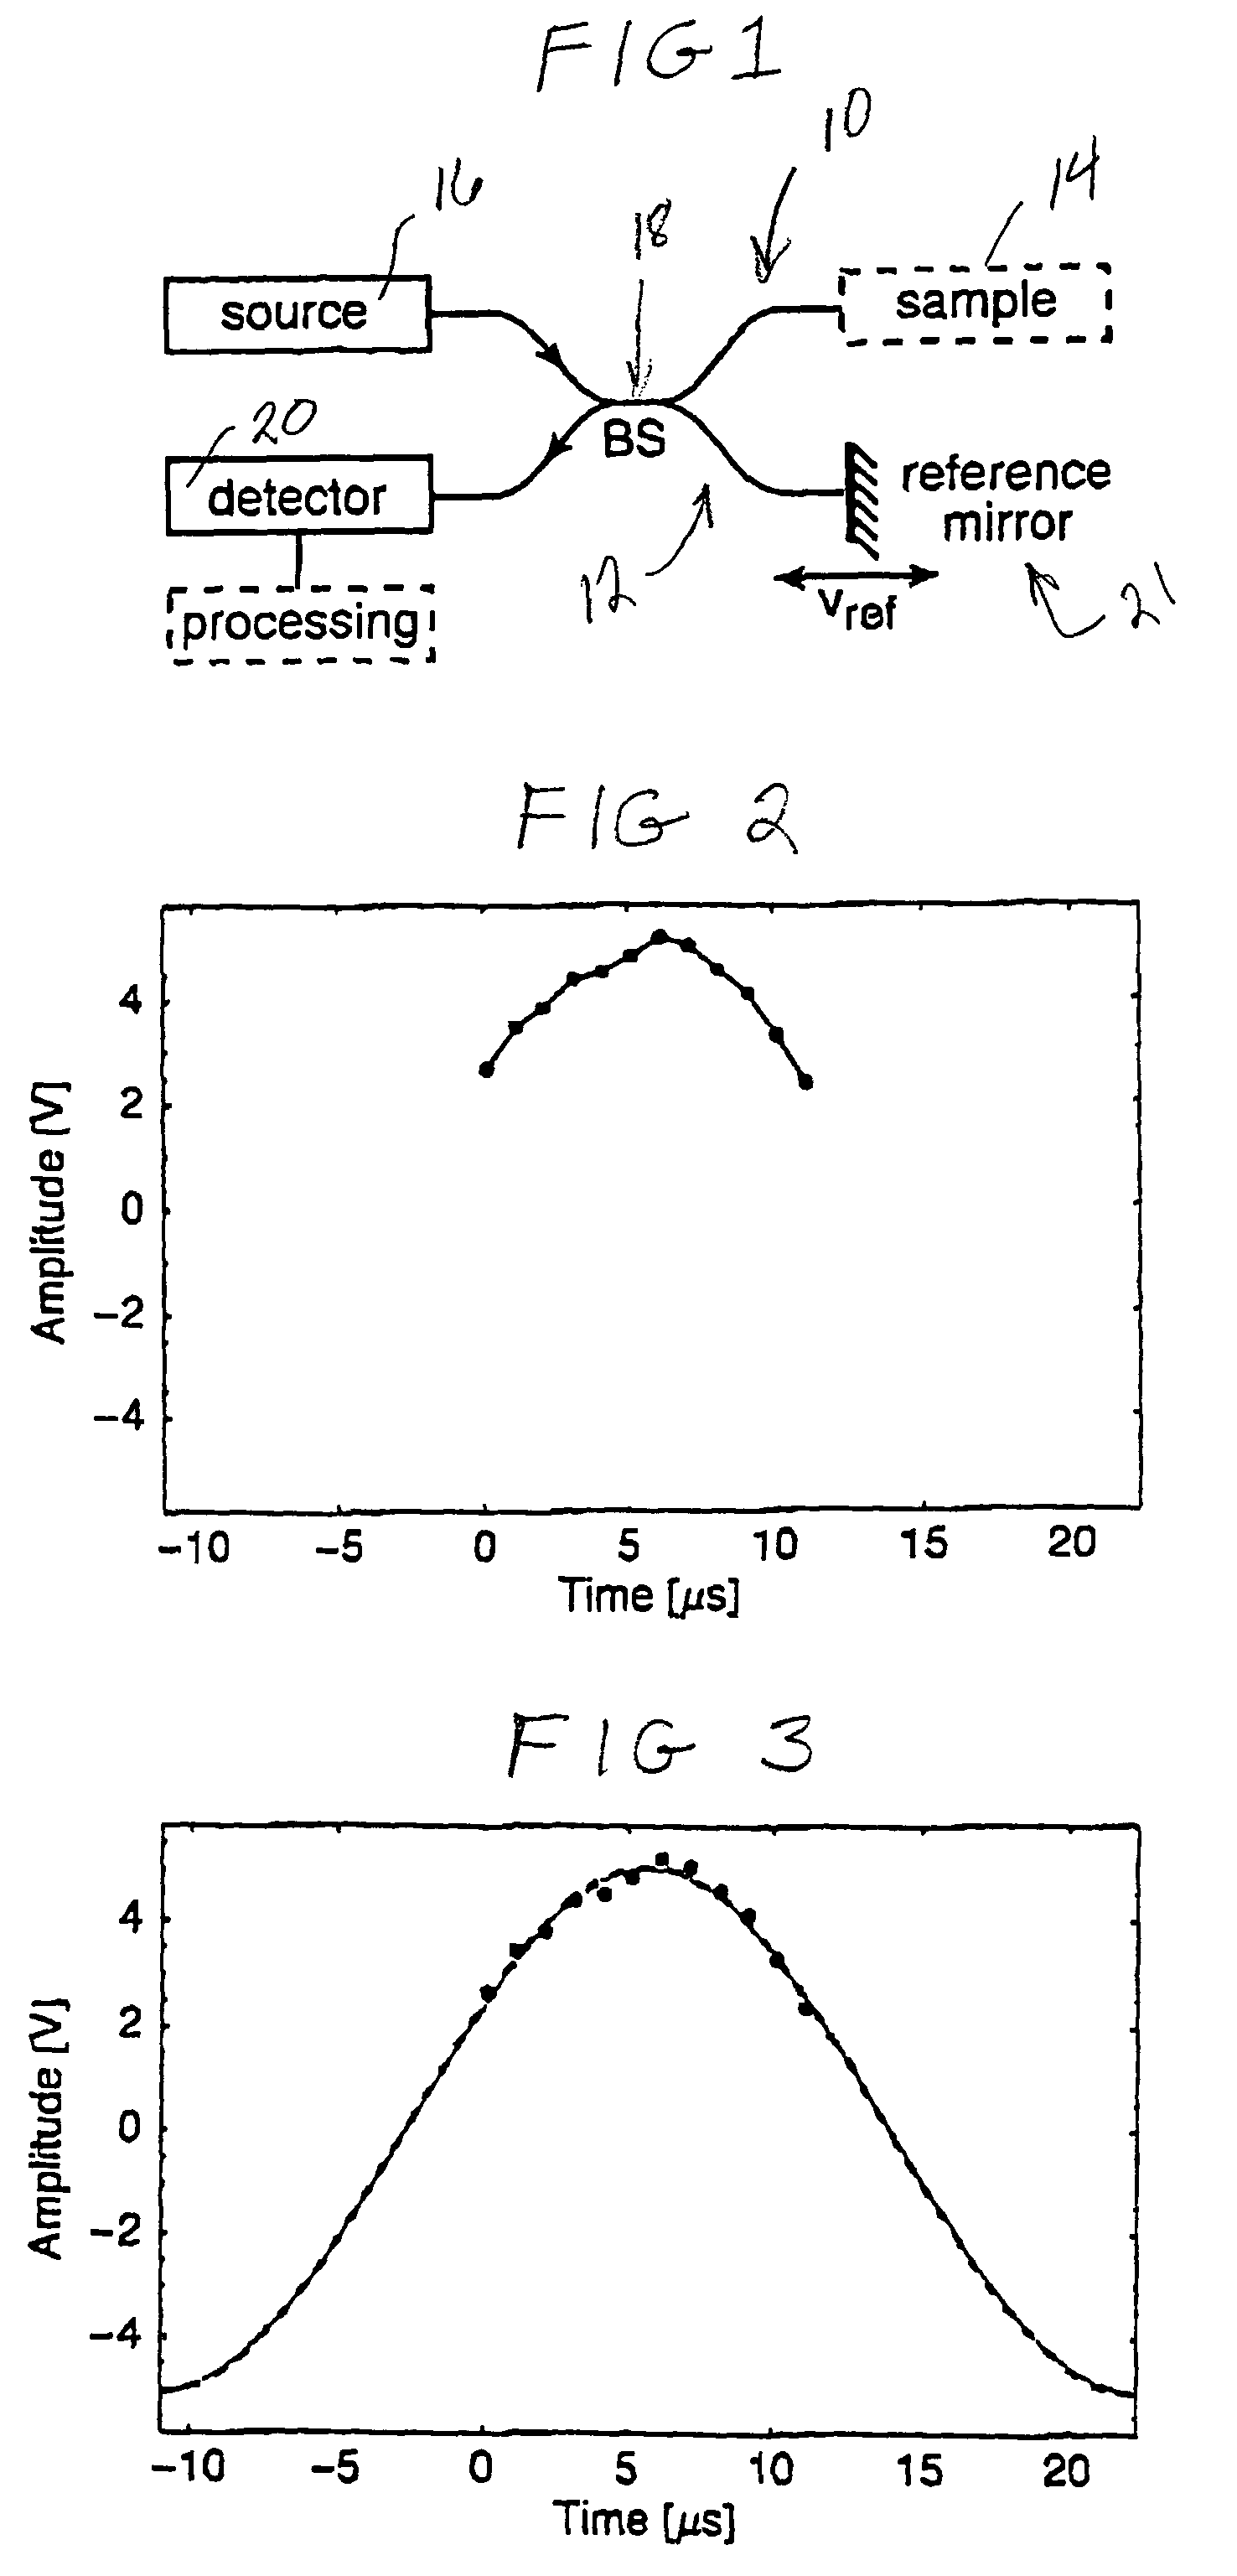
[0020]An OCT system that generates the OCT signal to be processed as shown in FIG. 1 is based on a Michelson inter...


PUM


Abstract

A method for processing signals, such as a tomography signal, in the time domain provides both high spatial resolution and high frequency resolution but at low cost. The method uses non-linear regression with a sinusoidal model to fit a sine wave to a portion of the signal that is less than a full cycle of a wave of the signal.

Description

STATEMENT REGARDING FEDERALLY SPONSORED RESEARCH OR DEVELOPMENT[0001]This work was supported by the National Science Foundation under Grant No. BES-9813959.CROSS-REFERENCE TO RELATED APPLICATIONS[0002]1. Technical Field[0003]The present invention is directed to a method of processing a signal, for example an optical coherence tomography signal, in the time domain and more particularly to such a signal processing method using non-linear regression with a sinusoidal model.[0004]2. Background of the Invention[0005]There are a number of known techniques for imaging tissue including ultrasound tomography and optical coherence tomography. In ultrasound tomography, a sound wave is launched into tissue where it is reflected off of interfaces, the sound energy returning to a detector. These interfaces are places where characteristics of the sound energy changes. The intensity of the returning signal is plotted as a function of time, where the time axis is transformed into a depth axis using ...

Claims


Application Information

Patent Timeline
Patent Type & Authority Patents(United States)
IPC IPC(8): A61B6/00A61B5/05G01B9/02
CPCG01B9/02088G01B9/02091
Inventor EDNEY, PAUL A.WALSH, JR., JOSEPH T.
Owner NORTHWESTERN UNIV
Learn More