[0008]The present invention is a
user interface for an
electronic trading system that enables the efficient and effective trading of semi-fungible goods. In a preferred embodiment, the
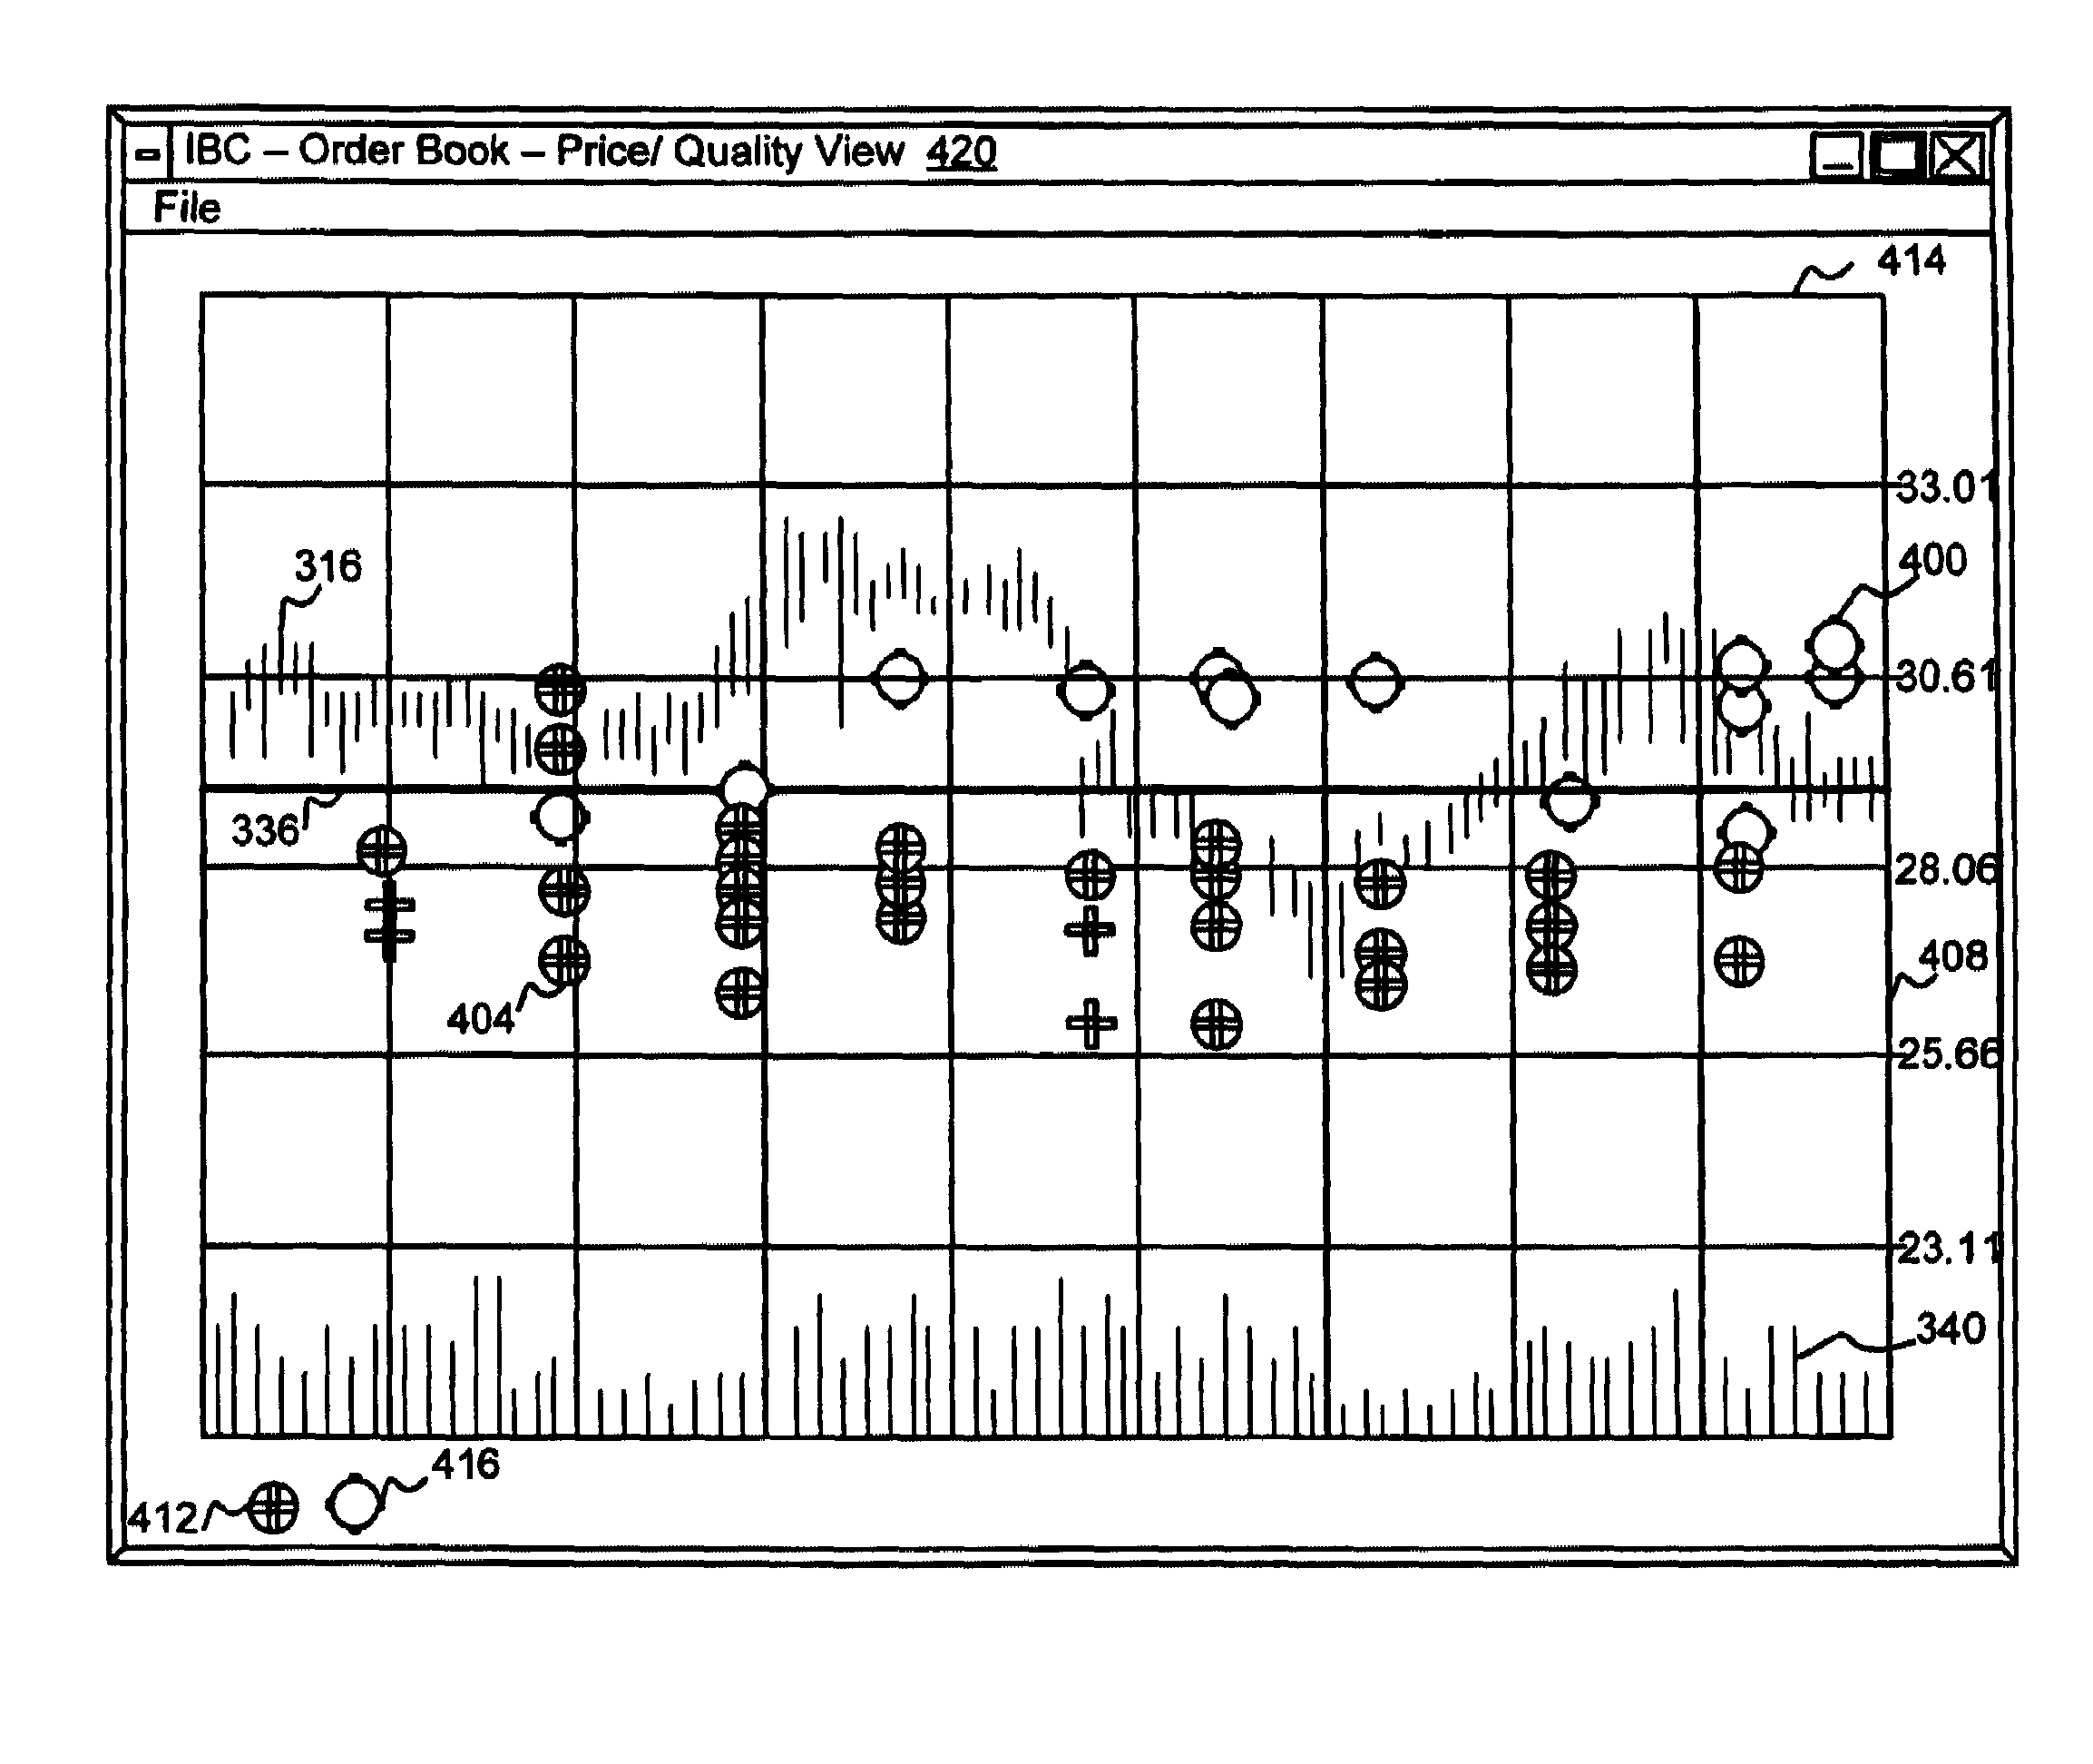
user interface displays information regarding a plurality of semi-fungible goods on a single screen to allow a trader to view markets for the different semi-fungible goods simultaneously. In one embodiment, the interface displays a series of vertical or horizontal lines (straight or curved), where each line represents a book for a single semi-fungible good. Then, in accordance with the present invention, the interface displays visual indicators of the bids and / or offers for the good such as icons or hatchmarks on the line. Thus, on a
single line, a trader can view the outstanding offers and bids for a semi-fungible good. Then, adjacent the line is at least one other line representing a semi-fungible good. The trader can view both lines and the visual indicators on the lines and track the markets for the two semi-fungible goods at the same time, allowing the trader to trade in semi-fungible goods efficiently. However, in accordance with the present invention, the interface may display any number of book axes simultaneously, depending upon a user's preferences. In accordance with one embodiment of the present invention, a trader can place an offer or bid for any displayed semi-fungible good book axis merely by dragging and dropping a bid or offer icon onto the relevant book axis at a desired price or value. In a further embodiment, the trader can select one of the displayed book axes to create a enlarged version of the book axis illustrating more detail. The enlarged version displays bid and offer information and can provide additional functionality, such as providing cumulative totals of quantities being bid or offered, or generating an average price for different bids and offers.
[0010]In a preferred embodiment, the use of a value axis and the display of a plurality of goods enables a trader to view the spreads between bids and offers (collectively “markets”) for different goods. The spread information allows the trader to quickly view what the current buying or selling price is and provides information on the liquidity and depth of the markets. In this embodiment, the spread is displayed in a different color to allow the trader to more easily view the activity in the markets.
[0011]In a further embodiment, the geometric dimensions of the visual indicators representing bids and offers indicate the quantity of the orders. Thus, for a
vertical axis, the width of a visual indicator represents the quantity of the order. The quantity values and associated dimensions (e.g. length, width, area) are determined on a
relative scale, to allow the display of a plurality of semi-fungible goods. For example, if one semi-fungible good has orders in quantities of 5, 10, and 15, the order for 15 will have a visual indicator that is three times as large as the order for 5. However, if this axis is alongside an axis that has orders in quantities of 100, 200 and 300, the 300 order will also have a visual indicator that is three times as large as the order for 100 and will be the same physical length as the order for 15 on the first axis. This allows the trader to quickly determine the relative quantities of orders along one axis, but still enables the display of a multiple of axes. If an
absolute scale were used, for example, a single display may not be able to display the second axis, having orders in the hundreds and the first axis, that has orders in the tens, as the length of the visual indicators in the second axis would occupy most of the display space. In a further embodiment, the user assigns a value for the maximum width of a visual indicator, and all orders of the assigned value and above would appear as the maximum width. In this instance, all orders less than the assigned value would be represented by proportional hatchmarks. This set value can be a percentile level for all orders in any given book axis and a constant level can be set across all book axes. This prevents orders of quantity significantly higher than the average across all orders in the book axis from overly biasing the scale.
[0012]In a further embodiment, an action line is provided to enable a trader to immediately be aware when the value or price of a good has approached a value that the trader has determined is appropriate to take an action, i.e., buy or sell. In an embodiment in which the semi-fungible goods are displayed with axes having the same units, the action line may be a straight line that represents a value common to all semi-fungible goods. For example, if the axes are displayed in units of implied volatility, the action line may be displayed as a straight line having an implied volatility of 10. This indicates that regardless of the particular option, the trader would prefer to buy options below the action line, i.e., with implied votatility below 10, and sell options above the action line, i.e., with implied volatility above 10. The use of an action line further enables a trader to trade efficiently and effectively in semi-fungible goods.


