Patient classification and prognositic method
a patient classification and prognositic method technology, applied in the field of patient classification and prognositic method, can solve the problems of slow progress in improving the treatment of patients, no strong evidence base to determine which patients require treatment intensification or indeed de-escalation, and poor prognosis. , the effect of good prognosis
- Summary
- Abstract
- Description
- Claims
- Application Information
AI Technical Summary
Benefits of technology
Problems solved by technology
Method used
Image
Examples
example 1
Developing the PanNET Gene Expression Assay
[0199]Developing the 228-gene NanoString Assay
[0200]An overview of the PanNET samples from the Verona cohort used for development and validation of the PanNET gene expression assay are shown in table 7. For the PanNET Verona Samples (n=222), the median RNA concentration was 222 ng / uL, range 2.8 to 4099 ng / uL. RNA Integrity number (RIN) ranged from 6.5 to 10.
TABLE 7PanNET Verona CohortMatched Clinical Data n = 205Fresh Frozen RNA provided from ARC-NET bio-bank n = 222228 NanoString Gene Panel n = 144 (including 6 replicates and 7matched normal samples)
[0201]The 228-gene assay was successfully developed as described in materials and methods. The assay was been performed on 144 samples from the Verona cohort including 6 replicates and 7 matched normal tissue. All samples passed QC as described in materials and methods. Heatmaps of the results for all samples and replicates were generated.
example 2
Survival Assessments in the Verona PanNET Cohort According to Subtype / Grade
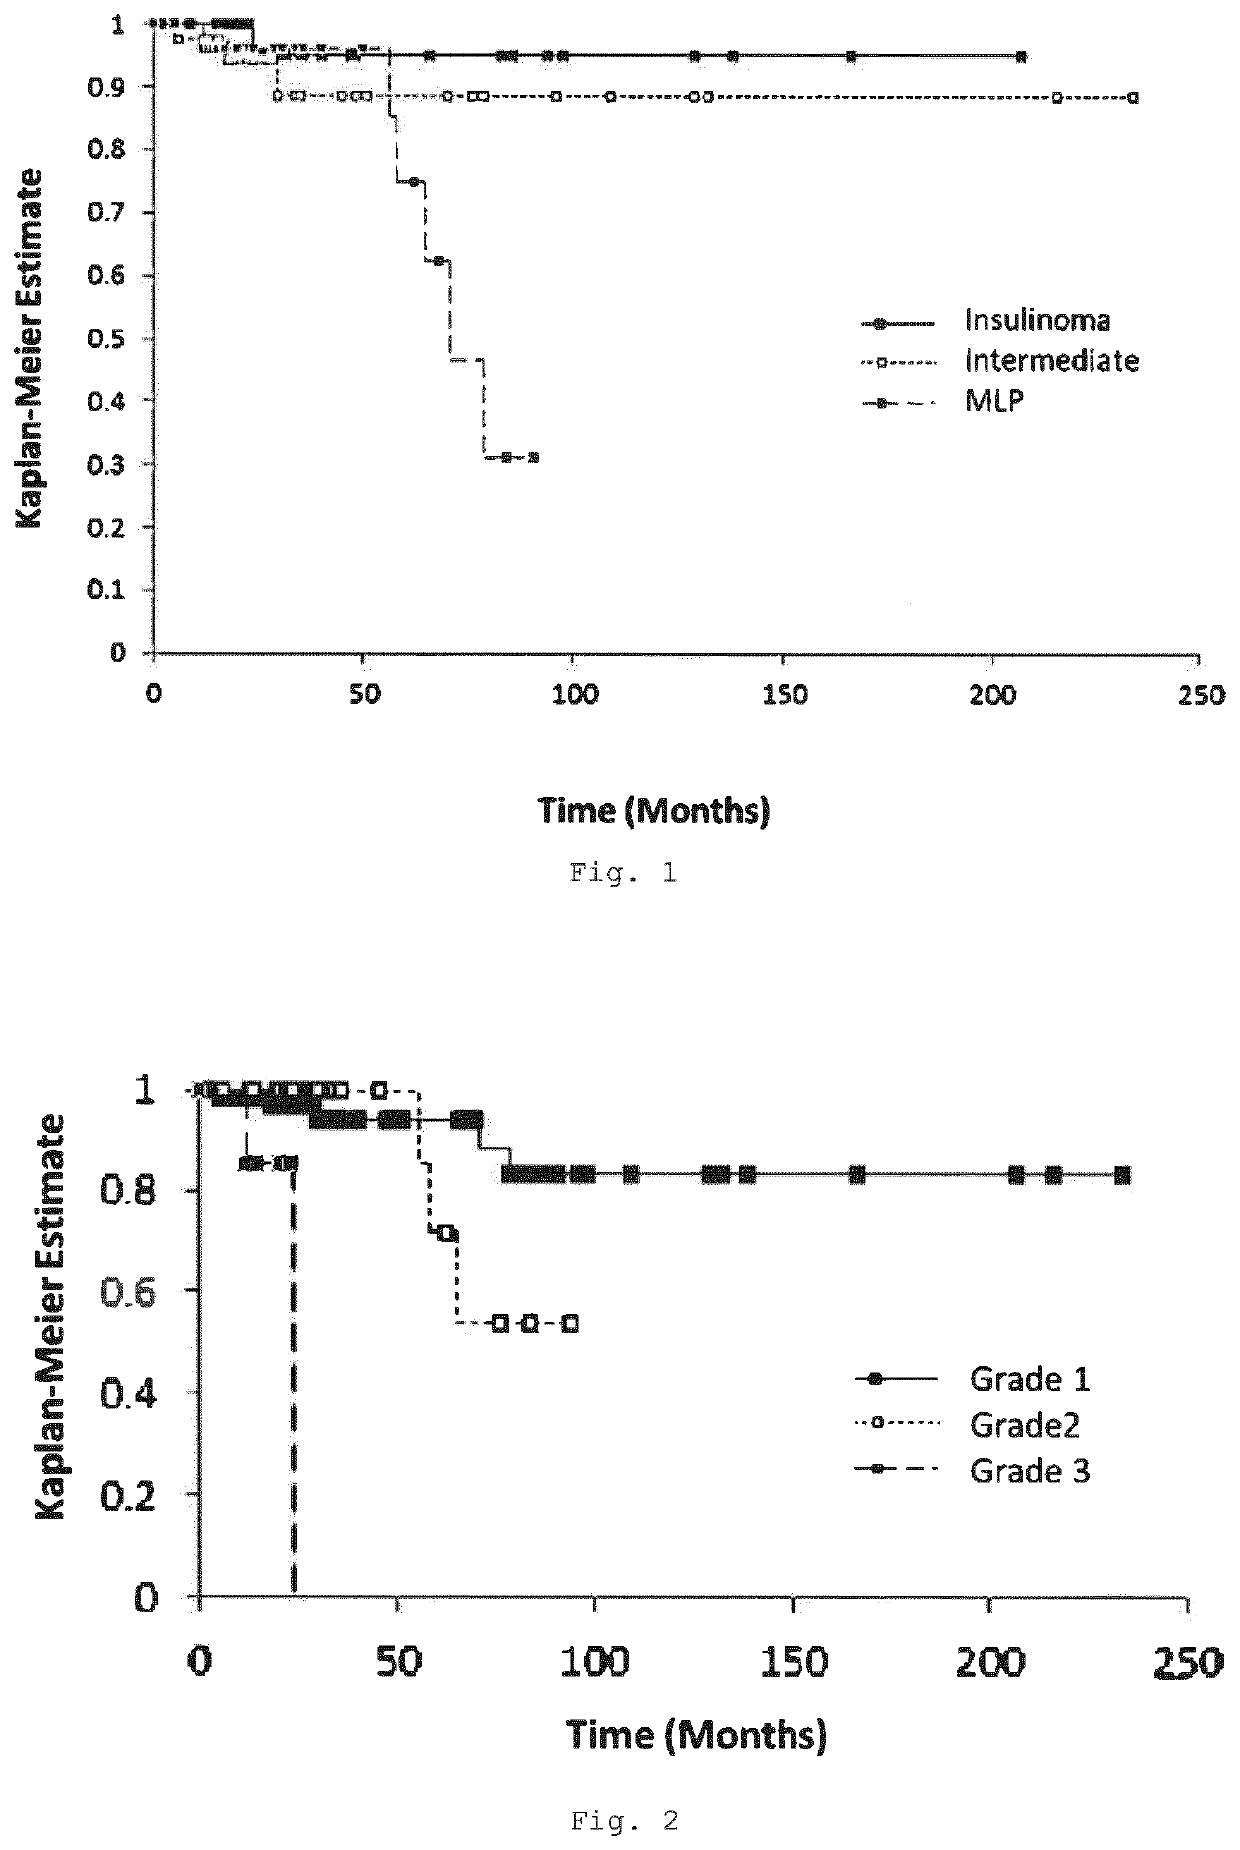
[0207]Clinical data was available for 106 patients whose samples were assessed using the 228-gene NanoString assay. OS according to subtype and grade were assessed as outlined in FIGS. 2 and 3, and Table 9 below.
TABLE 9Median1 yr5 yr10 yrNo.SurvivalOSOSOSPatientsTimerateraterateSubgroupInsulinoma37not reached100% 95%95%Intermediate40not reached98%89%89%MLP2971 months96%75%31%Grade168not reached99%94%82%230not reached100% 71%54%3824 months86% 0% 0%
[0208]The Kaplan-Meier Survival Curves were compared between subgroups and grades, as determined by Log Rank Hazard Ratio, are shown in Table 10.
TABLE 10Log RankHazard RatioP valueSubgroups ComparedInsulinomaIntermediate0.360.349InsulinomaMLP0.120.015IntermediateMLP0.0350.114Grades Compared120.480.296130.11230.08
[0209]The grade according to subtype in patients was then assessed using the 228-Gene NanoString Assay (n=106), and the results are shown in table 11.
TABLE 1...
example 3
Determination of Gene Mutations Present in PanNET Subtypes
[0216]Using the NGS assay, recurrent gene alterations were found at different levels in the Insulinoma, Intermediate and MLP PanNET subtypes, and the results are shown in table 12.
TABLE 12ATM mutationsNo.Total%Insulinoma3427%Intermediate4439%MLP53514% DAXX / ATRXNo.Total%Insulinoma342 7%Intermediate154335%MLP73520%MEN1Total%Insulinoma84219%Intermediate234353%MLP93526%mTOR pathway(TSC1 / TSC2 / PTEN)Total%Insulinoma142 2%Intermediate94321%MLP93526%
[0217]MEN1 mutations are significantly enriched in the intermediate subtype. DAXX / ATRX mutations significantly associated with MLP and intermediate subtype. TSC2 / PTEN / ATM mutations are associated with MLP and intermediate subtypes.
PUM
| Property | Measurement | Unit |
|---|---|---|
| Time | aaaaa | aaaaa |
| Time | aaaaa | aaaaa |
| Time | aaaaa | aaaaa |
Abstract
Description
Claims
Application Information
 - R&D
- Intellectual Property
- Life Sciences
- Materials
- Tech Scout
- Unparalleled Data Quality
- Higher Quality Content
- 60% Fewer Hallucinations
Browse by: Latest US Patents, China's latest patents, Technical Efficacy Thesaurus, Application Domain, Technology Topic, Popular Technical Reports.
© 2025 PatSnap. All rights reserved.Legal|Privacy policy|Modern Slavery Act Transparency Statement|Sitemap|About US| Contact US: help@patsnap.com

