
Web-Based Data Upload and Visualization Platform Enabling Creation of Code-Free Exploration of MS-Based Omics Data

a data upload and visualization platform technology, applied in the field of web-based data upload and visualization platform enabling, can solve the problems of tedious and time-consuming process of developing a web-based interface for ms data exploration, the creation of increasingly large datasets, and the difficulty of integrating data with other tools

Inactive Publication Date: 2019-01-31
WISCONSIN ALUMNI RES FOUND
View PDF0 Cites 5 Cited by
  • Summary
  • Abstract
  • Description
  • Claims
  • Application Information

AI Technical Summary

Benefits of technology

The present invention provides a platform for non-programmers that allows for the creation of online websites for exploring mass spectrometry data. The platform allows users to upload generic spreadsheets with processed results and offers various visualization options for viewing the data. The database is searchable and allows for easy processing and comparison of data. Users can also select different levels of access to the database and web portal based on their needs. Overall, the invention simplifies the process of creating and sharing custom web portals for mass spectrometry data.

Problems solved by technology

However, the creation of increasingly larger datasets presents a new challenge in both processing and interpretation of results.
Currently, publically available tools for the analysis of large scale mass spectrometry (MS) datasets—particularly multi-omic datasets—remain poorly developed.
However, currently the process of developing a web-based interface for MS data exploration is tedious and time consuming.
Construction of these tools requires programming and web development expertise which many researchers lack.
As a result, online data analysis portals are rarely developed, and if so, they are built by individual labs on a project-specific basis.
The majority of tools available for MS data analysis are standalone software utilities, which often makes data sharing between collaborators difficult.

Method used


Image

  • Web-Based Data Upload and Visualization Platform Enabling Creation of Code-Free Exploration of MS-Based Omics Data
  • Web-Based Data Upload and Visualization Platform Enabling Creation of Code-Free Exploration of MS-Based Omics Data
  • Web-Based Data Upload and Visualization Platform Enabling Creation of Code-Free Exploration of MS-Based Omics Data

Examples


example 1

A Platform for Codeless Generation of Custom Data Analysis Web Portals

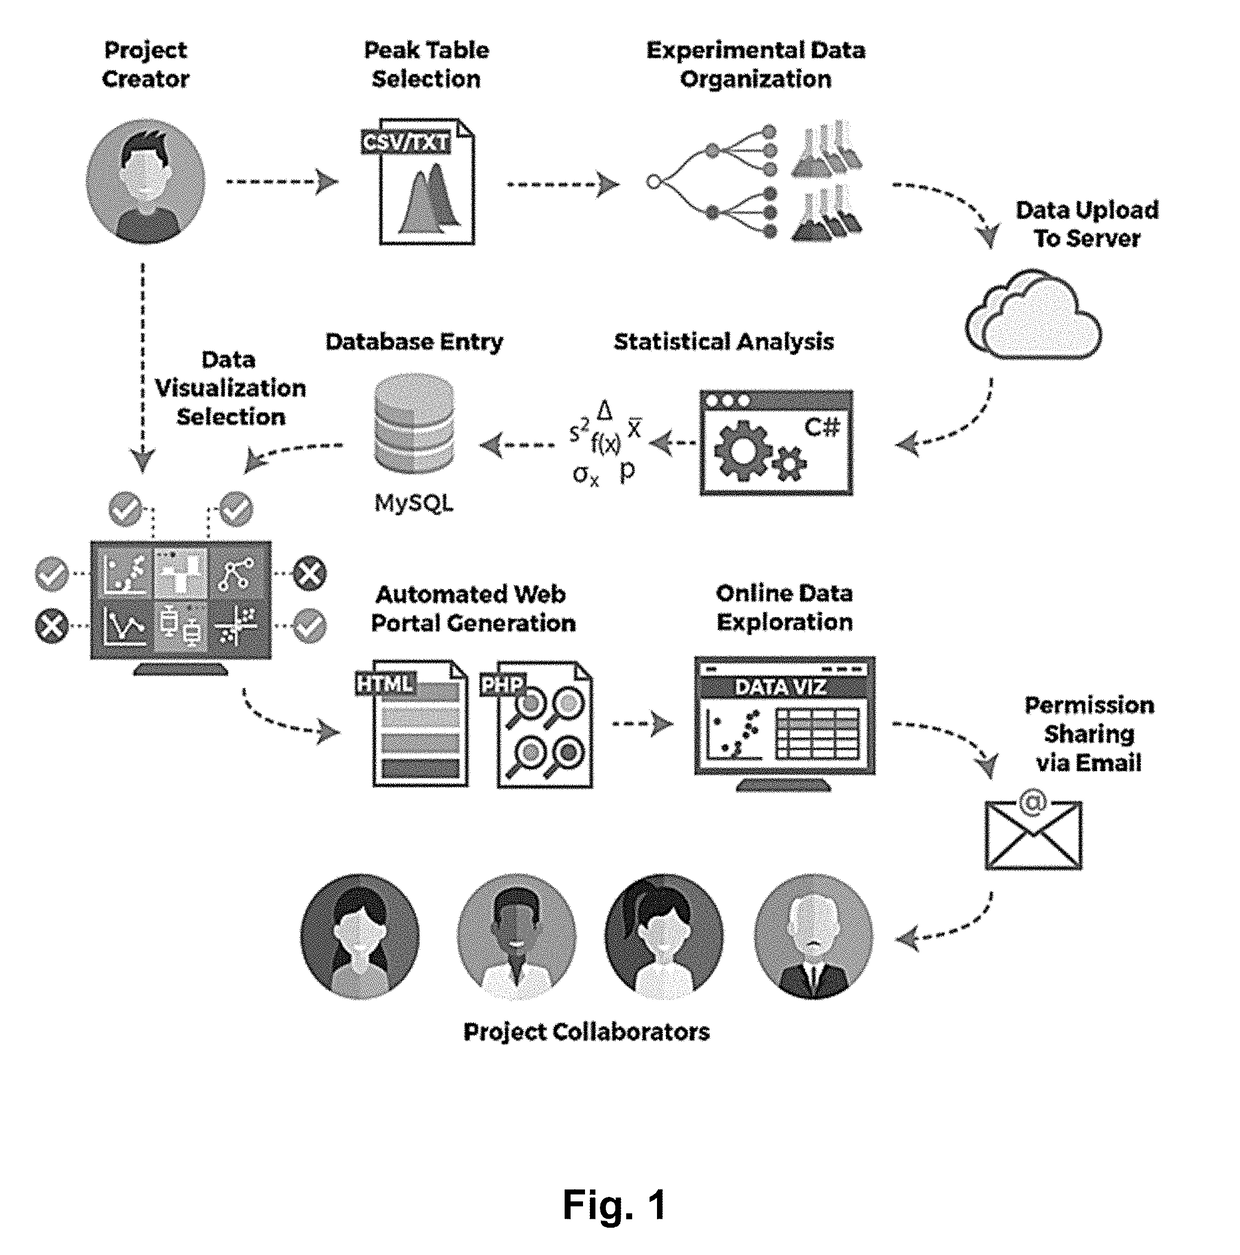
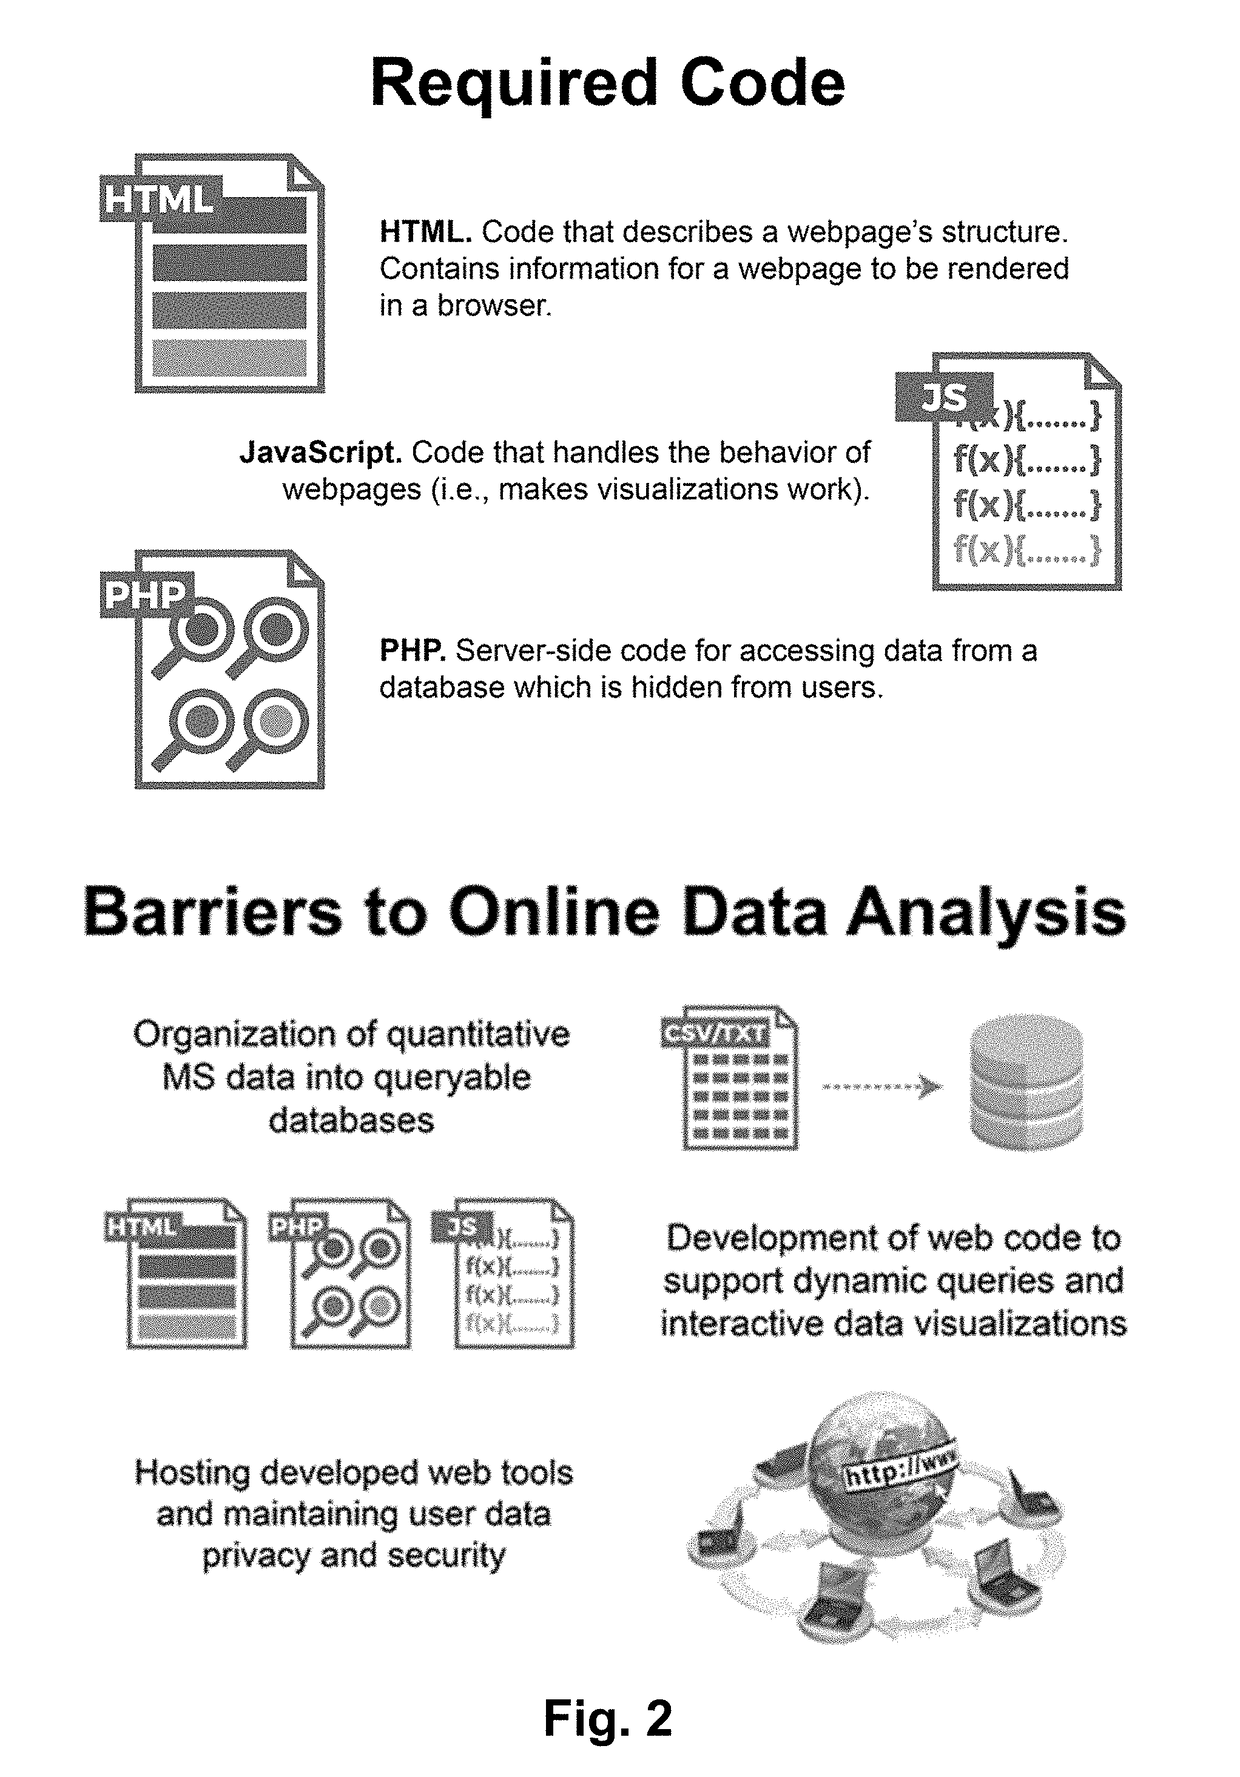
[0037]The web tools designed and developed in support of pre-existing data analysis have undoubtedly bolstered the data analysis process and public profile of such studies. However, a great deal of work was required for each instance for building and deploying those web portals. Additionally, their construction required extensive knowledge and application of several programming languages (JavaScript, PHP, C#, etc.) and coding libraries (D3.js, Angular.js, underscore.js, etc.), as well as expertise in relational database design (MySQL) which many researchers lack. Collectively, this creates a bottleneck to the construction and publication of similar web resources. In order to extend the benefit which these data exploration solutions can provide, to a broad audience, it is essential that complimentary tools are developed to facilitate the upload, organization, processing, and eventual online visualization of MS-base...

example 2

Data Upload

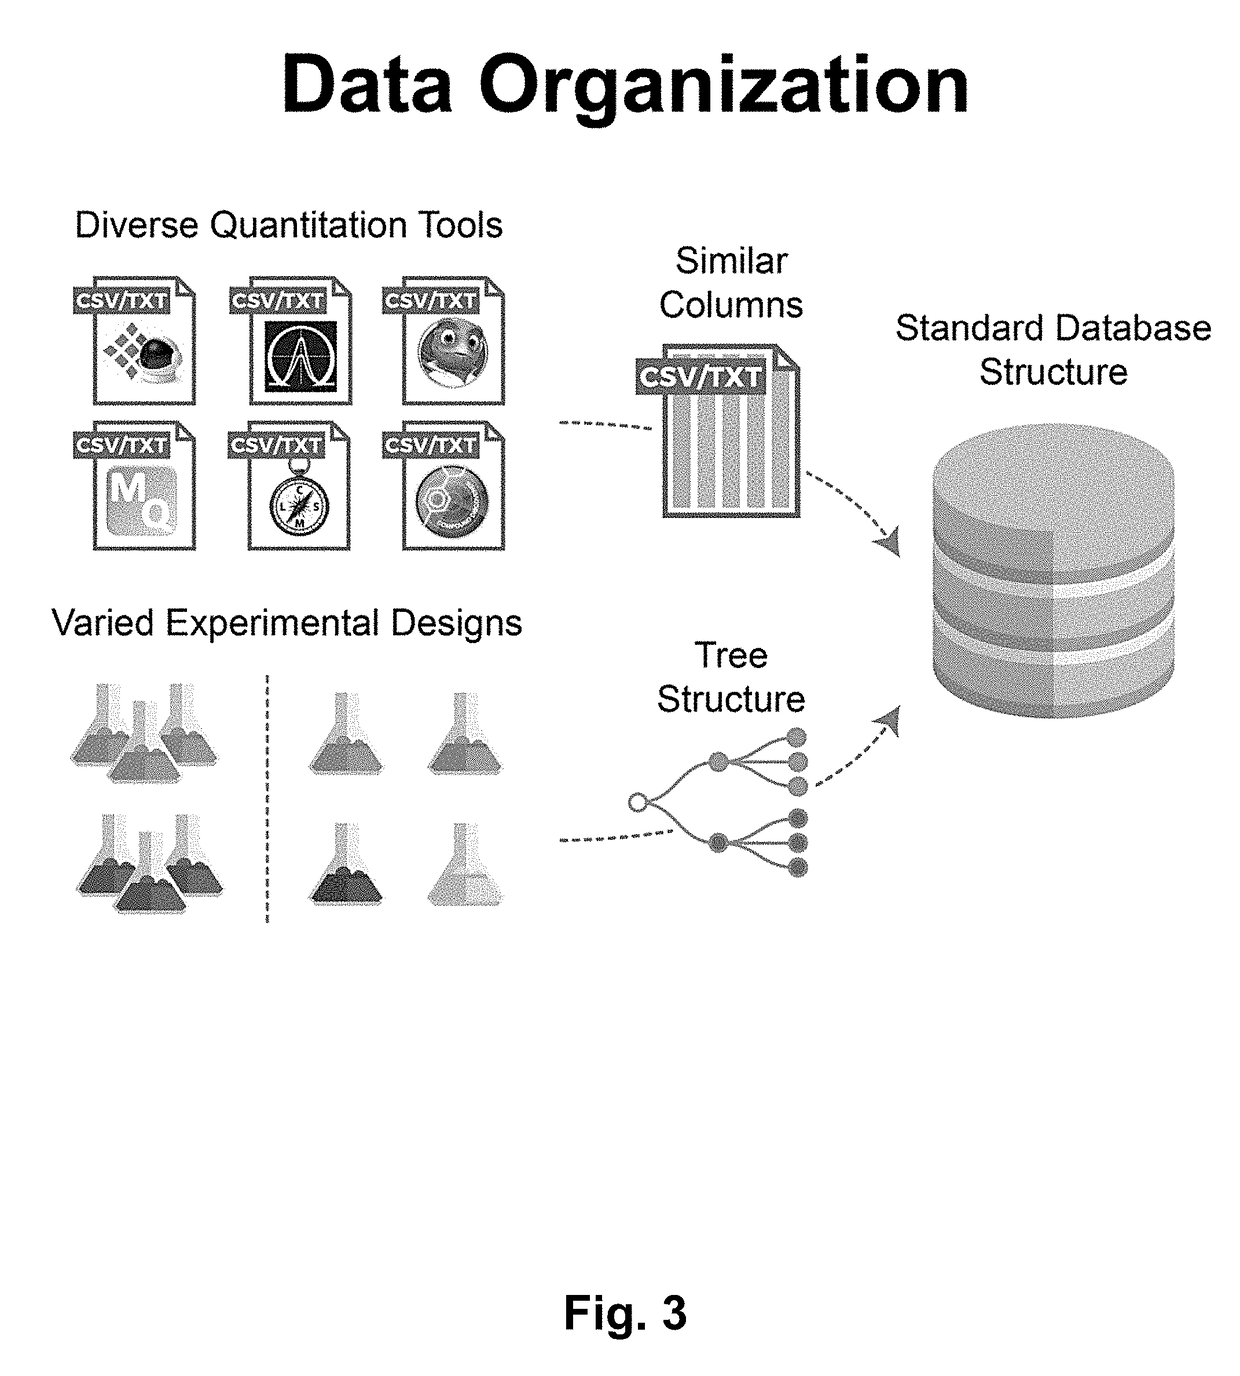
[0040]In order to achieve the overarching goal of the platform—rapid data upload and visualization—it is critical that all uploaded data be stored using a well-defined organizational structure. Storage of data in a predictable manner enables reuse of code for queries and visualizations across projects. Specifically, this characteristic storage will allow creation of functionally similar web portals—built around unique datasets—using identical blocks of code. In the present instance, all data is uploaded to a single central relational database (MySQL) with a static table structure. In order to ensure that user data is uploaded properly to this well-defined database, a number of considerations must be made. First, it is imperative that the upload functionality be flexible enough to handle data from a broad array of experiment types (proteomics, metabolomics, lipidomics, etc.). Second, the hierarchical organization of data and the various experimental designs must be account...

example 3

Data Processing and Database Entry

[0047]At this point in the generation of a custom web portal, a user has created a new Project and uploaded at least one peak table with appropriate organizational information. In order to make individual measurements accessible on-command, it is required that the data be entered into a logically-structured database (MySQL is used here) to enable subsequent querying and visualization.

[0048]For each uploaded file, entries for all column headers have been stored in a MySQL data table which indicates whether that column contains ‘Unique Identifiers,’‘Feature Metadata,’‘Quantitative Data,’ or if it should be discarded from subsequent processing. Each ‘Quantitative Data’ column is assumed to arise from a single replicate MS experiment. For these entries, the user-provided replicate name along with its associated condition is stored. Using this information values from the user-provided peak table can be extracted and inserted into a structured MySQL datab...


PUM


Abstract

The present invention provides a platform that enables codeless generation of online mass spectrometry data exploration portals. The platform facilitates upload of generic spreadsheets containing processed mass spectrometry results (e.g., peak tables) and enables on-the-fly hierarchical organization of data. Following data upload, platform users can select individual visualizations to add to their custom web portal from a menu of options. Based on these selections, a complete webpage is constructed with all associated functionality embedded. These custom web portals can then be shared with collaborators and other researchers at the discretion of the creator via a developed user permissions sharing scheme.

Description

CROSS-REFERENCE TO RELATED APPLICATIONS[0001]This application claims priority from U.S. Provisional Patent Application No. 62 / 539,081, filed Jul. 31, 2017, which is incorporated by reference herein to the extent that there is no inconsistency with the present disclosure.STATEMENT REGARDING FEDERALLY SPONSORED RESEARCH OR DEVELOPMENT[0002]This invention was made with government support under GM108538 awarded by the National Institutes of Health. The government has certain rights in the invention.BACKGROUND OF THE INVENTION[0003]Recent advances in mass spectrometry profiling technologies have afforded substantial increases in both speed of data acquisition and experimental throughput. These advances have opened the door to large-scale MS-based profiling studies where the analysis of hundreds or even thousands of samples is considered routine. However, the creation of increasingly larger datasets presents a new challenge in both processing and interpretation of results. Currently, publ...

Claims


Application Information

Patent Timeline
Patent Type & Authority Applications(United States)
IPC IPC(8): G06F3/0482G06F17/30H04L29/06H01J49/00
CPCG06F3/0482G06T2200/24G06F16/95G06T11/206H04L63/10H01J49/0036G06F16/958H04L63/105H04L63/104G06Q10/101G06Q10/10
Inventor KWIECIEN, NICHOLAS WILLIAMWESTPHALL, MICHAEL SCOTTCOON, JOSHUA JACQUES
Owner WISCONSIN ALUMNI RES FOUND
Learn More